


In what turned out to be a “kitchen sink” year, corporate managers used COVID-19 as a justification to write-down more assets in 2020 than any year since 2008. With the books “cleaned up”, S&P 500 companies are on pace to record the lowest amount of write-downs in 15 years. We see a similar trend in Small Cap and All Cap companies.
In this report, we’ll look at the write-down trends across the S&P 500, NC 1500 (our proxy for Small Cap companies), and the NC 2000 (our proxy for All Cap companies).
These reports leverage more reliable fundamental data[1] that overcomes flaws with legacy fundamental datasets. Our Earnings Distortion factor generates idiosyncratic alpha.
S&P 500 1H21: Write-Downs Are 81% Lower than 1H20
The total value of pre-tax[2] write-downs for the S&P 500 in 1H21 is $33.6 billion, or just 12% of the total write-downs in 2020. Our analysis shows write-downs tend to spike (“kitchen sink” effect) when stock markets and economic growth sink as they did during the financial crisis of 2008, the economic turbulence in 2015, and the pandemic-driven disruptions in 2020.
Figure 1: S&P 500: Total Write-Downs Pre-Tax: 2004[3] through First Half of 2021
![S&P 500: Total Write-Downs Pre-Tax: 2004[3] through First Half of 2021](https://ibkrcampus.com/wp-content/uploads/2021/10/newconstructs_10-20-21_1.png)
Sources: New Constructs, LLC, and company filings
S&P 500 1H21: Write-Downs by Quarter
In 1Q21, S&P 500 companies disclosed $16.3 billion in pre-tax write-downs, 84% less than 1Q20 and just 6% of the total for 2020. In 2Q21, we found another $17.3 billion in pre-tax write-downs for the S&P 500. See Figure 2.
Figure 2: S&P 500: Write-Downs in 2020 vs 1Q21 and 2Q21
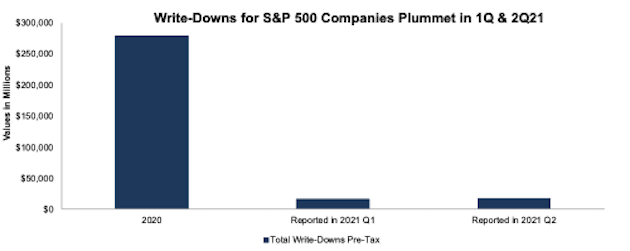
Sources: New Constructs, LLC, and company filings
S&P 500: Write-Downs In 1H21 vs 1H20
Pre-tax write-downs in the first half of 2021 totaled $33.6 billion or 19% of the total pre-tax value of write-downs in the first half of 2020.
Click here to read the full article
—
This article originally published on October 12, 2021.
Disclosure: David Trainer, Kyle Guske II, and Matt Shuler receive no compensation to write about any specific stock, sector, style, or theme.
Follow us on Twitter, Facebook, LinkedIn, and StockTwits for real-time alerts on all our research.
[1] For 3rd-party reviews, including The Journal of Financial Economics, on our more reliable fundamental data, click here and here.
[2] This report focuses on “pre-tax” values though we also have the after-tax values for all views presented.
[3] Our S&P 500 research goes back to 2004. Our data on All Cap and Small Cap stocks go back to 1998.
Click here to download a PDF of this report.
Disclosure: New Constructs
David Trainer, Kyle Guske II, Sam McBride, Matt Shuler, Alex Sword, and Andrew Gallagher receive no compensation to write about any specific stock, style, or theme.
The information and opinions presented in this report are provided to you for information purposes only and are not to be used or considered as an offer or solicitation of an offer to buy or sell securities or other financial instruments. New Constructs has not taken any steps to ensure that the securities referred to in this report are suitable for any particular investor and nothing in this report constitutes investment, legal, accounting or tax advice. This report includes general information that does not take into account your individual circumstance, financial situation or needs, nor does it represent a personal recommendation to you. The investments or services contained or referred to in this report may not be suitable for you and it is recommended that you consult an independent investment advisor if you are in doubt about any such investments or investment services.
Information and opinions presented in this report have been obtained or derived from sources believed by New Constructs to be reliable, but New Constructs makes no representation as to their accuracy, authority, usefulness, reliability, timeliness or completeness. New Constructs accepts no liability for loss arising from the use of the information presented in this report, and New Constructs makes no warranty as to results that may be obtained from the information presented in this report. Past performance should not be taken as an indication or guarantee of future performance, and no representation or warranty, express or implied, is made regarding future performance. Information and opinions contained in this report reflect a judgment at its original date of publication by New Constructs and are subject to change without notice. New Constructs may have issued, and may in the future issue, other reports that are inconsistent with, and reach different conclusions from, the information presented in this report. Those reports reflect the different assumptions, views and analytical methods of the analysts who prepared them and New Constructs is under no obligation to insure that such other reports are brought to the attention of any recipient of this report.
New Constructs’ reports are intended for distribution to its professional and institutional investor customers. Recipients who are not professionals or institutional investor customers of New Constructs should seek the advice of their independent financial advisor prior to making any investment decision or for any necessary explanation of its contents.
In-depth risk/reward analysis underpins our stock rating. Our stock rating methodology grades every stock according to what we believe are the 5 most important criteria for assessing the quality of a stock. Each grade reflects the balance of potential risk and reward of buying that stock. Our analysis results in the 5 ratings described below. Very Attractive and Attractive correspond to a “Buy” rating, Very Unattractive and Unattractive correspond to a “Sell” rating, while Neutral corresponds to a “Hold” rating.
Disclosure: Interactive Brokers
Information posted on IBKR Campus that is provided by third-parties does NOT constitute a recommendation that you should contract for the services of that third party. Third-party participants who contribute to IBKR Campus are independent of Interactive Brokers and Interactive Brokers does not make any representations or warranties concerning the services offered, their past or future performance, or the accuracy of the information provided by the third party. Past performance is no guarantee of future results.
This material is from New Constructs and is being posted with its permission. The views expressed in this material are solely those of the author and/or New Constructs and Interactive Brokers is not endorsing or recommending any investment or trading discussed in the material. This material is not and should not be construed as an offer to buy or sell any security. It should not be construed as research or investment advice or a recommendation to buy, sell or hold any security or commodity. This material does not and is not intended to take into account the particular financial conditions, investment objectives or requirements of individual customers. Before acting on this material, you should consider whether it is suitable for your particular circumstances and, as necessary, seek professional advice.
Disclosure: Tax-Related Items (Circular 230 Notice)
The information in this material is provided for informational purposes only and does not constitute tax advice and cannot be used by the recipient or any other taxpayer to avoid penalties under any federal, state, local or other tax statutes or regulations, or to resolve any tax issue.


