


Options volumes and open interest have been moving up steadily. Charts of their growth may not be as dramatic as those of your favorite penny stocks or cryptocurrencies, but they too have risen to records. As an ever-increasing number of investors gravitate to listed equity derivatives, I also hear some misconceptions about the topic. I believe it is important to clear up some common misunderstandings about volatility that occur in financial media.
Historical volatility is too low.
It is important to understand what historical volatility represents. It is a statistical measure of the dispersion returns of returns for an underlying share or index, usually calculated with standard deviation. What many investors fail to understand is that the historical volatility can be measured over different time periods. Consider the following graph:
S&P 500 Index vs. Implied and 7, 20, 60 and 200 Day Historical Volatilities
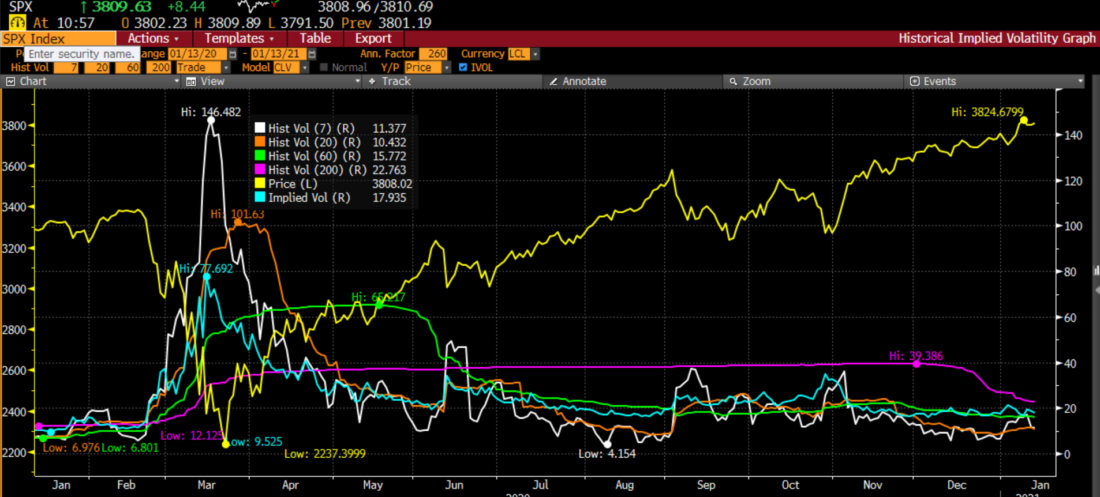
Source: Bloomberg
We can see how the measures differ depending upon how long of a time period we choose. It is clear that the 200 day volatility is declining as the events of the spring recede from the calculation. Successful volatility trading requires the trader to consider the relationship between the implied volatility of their desired options and the historical volatility that best matches the time to expiry of their options.
Implied Volatilities are Too High.
When we look at the graph above, we see that the implied volatility of 17.935 is significantly higher than the 20 day historical reading of 10.432. Since the implied volatility shown above is for at-money options with a 30 day life, and 30 calendar days encompass about 22 trading days it is relevant comparison. That certainly seems high. Is the market crazy? In my experience, index options markets are rarely crazy. Traders are clearly anticipating that volatility could increase during the ensuing 30 days. Remember that we are exiting a holiday period and entering a few weeks that encompass a potentially testy Inauguration, quarterly earnings season, and a late January Federal Reserve meeting. All are potential volatility catalysts. Traders can certainly take a view that the implied volatility is indeed too high, but that is more a matter of reasonable debate than a prima facie mistake.
There is something else that is important to keep in mind. Most historical volatility measures use close-to-close volatilities, but most active traders and hedgers consider intraday movements. Let’s say a stock moves up and down 1% each day before closing unchanged. A close-to-close historical measure would be zero, while an intraday calculation would be around 16. Volatility measures that consider daily ranges rather than closes tend to read higher.
VIX is Too High Relative to Implied Volatility.
It is very important to understand exactly what the CBOE Volatility Index (VIX) actually measures. Allow me to offer you the CBOE’s description of the VIX calculation:
Cboe Options Exchange® (Cboe Options®) calculates the VIX Index using standard SPX options and weekly SPX options that are listed for trading on Cboe Options. Standard SPX options expire on the third Friday of each month and weekly SPX options expire on all other Fridays. Only SPX options with Friday expirations are used to calculate the VIX Index.* Only SPX options with more than 23 days and less than 37 days to the Friday SPX expiration are used to calculate the VIX Index. These SPX options are then weighted to yield a constant maturity 30-day measure of the expected volatility of the S&P 500 Index. (https://www.cboe.com/tradable_products/vix/faqs/)
Because the CBOE uses a range of SPX options in its calculations, it can and does differ from the at-money implied volatility of a given at-money 30 day option. The current VIX reading is 22.31, which is obviously greater than the implied volatility of 17.935 that we saw for SPX options. The difference occurs because the VIX calculation includes out of the money options. It should become obvious when we consider the graph below:
Term Structure of Implied Volatility for At- Below- and Above-Market SPX Options

Source: Bloomberg
It is normal for below market index options to have higher implied volatilities than their at-money counterparts. Recently, with the demand for call options from speculative traders, short-term above market options also have implied volatilities above those of at-money options. With those considerations in place, it makes perfect sense that an index like VIX that includes options with higher implied volatilities would have a level above that of the basic at-money options.
VIX is the Market’s Fear Gauge.
This is a convenient rubric, but it is fundamentally inaccurate. Let’s refer once again to the CBOE’s definition of VIX:
The VIX Index is a financial benchmark designed to be an up-to-the-minute market estimate of expected volatility of the S&P 500 Index, and is calculated by using the midpoint of real-time S&P 500® Index (SPX) option bid/ask quotes. More specifically, the VIX Index is intended to provide an instantaneous measure of how much the market thinks the S&P 500 Index will fluctuate in the 30 days from the time of each tick of the VIX Index. https://www.cboe.com/tradable_products/vix/faqs/
Do you see the word “fear” mentioned anywhere in that definition. No, you don’t. Implied volatility and hence VIX tend to rise when markets are nervous, there is no mechanism that ties the two together. It has also become less uncommon for VIX to rise on up days. That goes back to the demand for calls from speculative call buyers pushing up those prices.
One of my goals as an options trader turned strategist is to increase our clients’ understanding of the workings of options and the options markets. I sincerely hope this accomplishes some of that goal.
Other useful links:
Understand the “Rule of 16” – Traders’ Insight
Making Sense of the Three Types of Volatility – Traders’ Insight
Disclosure: Interactive Brokers
The analysis in this material is provided for information only and is not and should not be construed as an offer to sell or the solicitation of an offer to buy any security. To the extent that this material discusses general market activity, industry or sector trends or other broad-based economic or political conditions, it should not be construed as research or investment advice. To the extent that it includes references to specific securities, commodities, currencies, or other instruments, those references do not constitute a recommendation by IBKR to buy, sell or hold such investments. This material does not and is not intended to take into account the particular financial conditions, investment objectives or requirements of individual customers. Before acting on this material, you should consider whether it is suitable for your particular circumstances and, as necessary, seek professional advice.
The views and opinions expressed herein are those of the author and do not necessarily reflect the views of Interactive Brokers, its affiliates, or its employees.
Disclosure: Options Trading
Options involve risk and are not suitable for all investors. Multiple leg strategies, including spreads, will incur multiple commission charges. For more information read the "Characteristics and Risks of Standardized Options" also known as the options disclosure document (ODD) or visit ibkr.com/occ


