


Welcome to October. Autumn weather arrived in the Northeastern US just as the calendar turned. Normal people might begin thinking about fall foliage, apple cider, pumpkins, and sweaters, but investors and options traders alike need to begin considering how this month’s earnings season might affect their strategies.
Some of you might be thinking, “Earnings season? That doesn’t start for nearly two weeks.” Hey, you’re not wrong. JPMorgan Chase (JPM) and several of its other major bank peers announce results on October 14th, kicking off the festivities. Many other financials and a wide range of industrial companies announce during the following week. Tesla (TSLA) leads the pack of mega-cap tech stocks when they report on the 19th, and the wave crests in the last week of the month.
Although we have been in a bit of an earnings drought, some of the recent results have not been encouraging. In recent days, FedEx (FDX), Nike (NKE), CarMax (KMX), and Micron (MU) all reported either disappointing earnings, reduced guidance, or both. Four companies hardly make a robust sample, but they are a disproportionate piece of the available data and represent a fairly wide swath of the economy (transportation, consumer, tech). Ready or not, we need to be thinking about how to position or hedge ourselves for what could be a rockier than normal set of results.
Even though earnings releases and the market’s subsequent reactions are difficult to predict, options traders utilize a predictable set of strategies to prepare themselves. One of the most basic tactics is to boost implied volatilities for the dates that encompass earnings releases. Compare these two implied volatility graphs for JPM and TSLA, noting the relative levels of implied volatilities for options expiring on the 14th and 21st of this month:
JPM: Implied Volatility by Expiry, October 14th (green), October 21st (yellow), November 18th (orange)
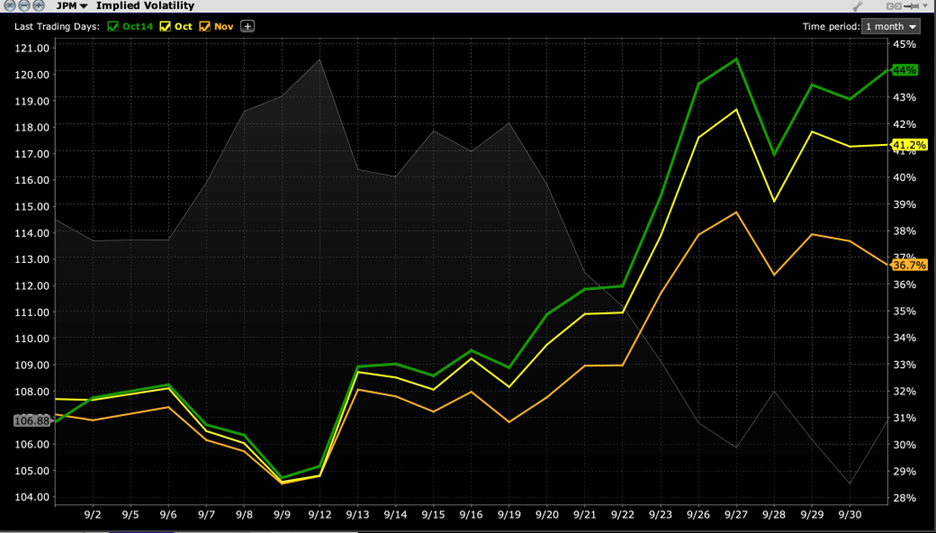
Source: Interactive Brokers
TSLA: Implied Volatility by Expiry, October 14th (blue), October 21st (yellow), November 18th (orange)
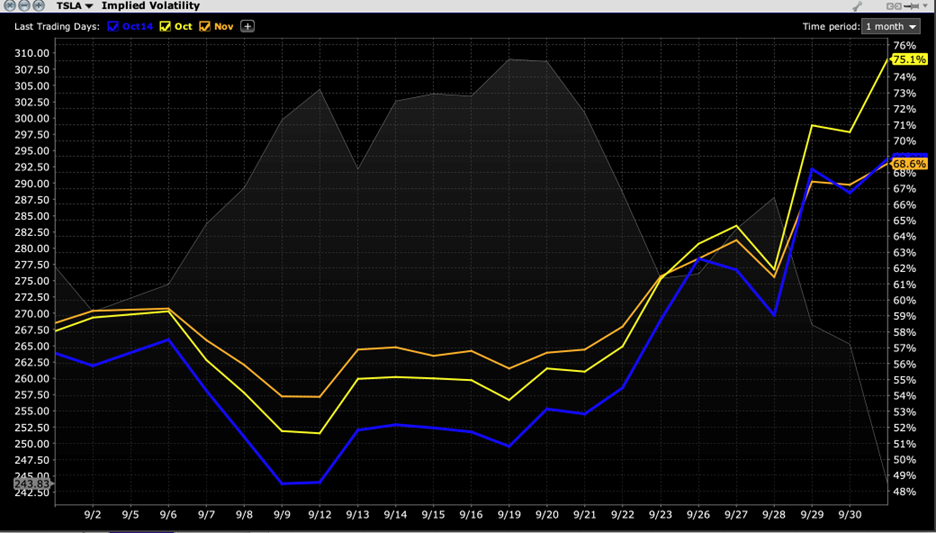
Source: Interactive Brokers
Note that JPM options expiring on the 14th have the highest implied volatility while those expiring on the 21st are highest for TSLA. (We use the following month’s regular expiration as a control group for “normal” volatility).
This should make perfect sense. We know that companies have a propensity for greater movement after they release earnings, and we can track how much a given stock has moved after prior reports. According to Bloomberg data, JPM’s average post-earnings move is 2.04% and TSLA’s is 7.35%. Market makers use that sort of data in their models, which tend to be reflected as a boost to the one-day volatility for the earnings date.
If we think of an expiration’s implied volatility as the market’s best estimate of the average daily moves that the stock will experience during that ensuing timeframe, the relative importance of a day with excess volatility will increase as that day approaches. That is why we see the earnings week’s volatilities increasing faster than those of the non-earnings weeks. Bear in mind also that JPM’s earnings also that JPM’s report on the 14th will still affect the pricing for options expiring on the 21st, though in a less dominant manner, while TSLA’s earnings should have no impact on options expiring 5 days prior (barring a pre-announcement).
There are 9 trading days after today until October 14th, 14 until the 21st, and 34 until November 18th. The effect of an extra day of volatility is much more muted by the following month, which is why the November volatilities seem relatively unaffected.
Here is what to keep in mind:
- stocks tend to reflect higher implied volatilities for options that expire in the week of their earnings release than those in surrounding weeks (an “earnings boost”)
- stocks that have demonstrated a higher propensity for larger post-earnings moves will tend to see greater implied volatility boosts in their earnings periods
- the effect of an earnings boost grows in relative importance as we approach an earnings date
- the implied volatilities tend to drop dramatically after the earnings boost is removed from the calculation
These factors introduce a key element of timing for speculators and hedgers. Even though implied volatilities tend to increase as earnings dates approach, the options may become less expensive in absolute dollar terms because options with higher implied volatilities tend to decay faster. Many speculators prefer to wait until the final day, hoping to avoid as much decay as possible, but they may face wider spreads and worse liquidity if fewer are willing to take the other side just before an event. Also, volatility assumptions may change dramatically based upon supply and demand and whether similar companies have beaten or missed their numbers.
Trading ahead of earnings can be as much art as science, especially in a quarter when results and outlooks may be in greater flux than normal. Hopefully an understanding of the factors that move implied volatilities ahead of earnings releases can move the needle a bit more in one’s favor.
Disclosure: Interactive Brokers
The analysis in this material is provided for information only and is not and should not be construed as an offer to sell or the solicitation of an offer to buy any security. To the extent that this material discusses general market activity, industry or sector trends or other broad-based economic or political conditions, it should not be construed as research or investment advice. To the extent that it includes references to specific securities, commodities, currencies, or other instruments, those references do not constitute a recommendation by IBKR to buy, sell or hold such investments. This material does not and is not intended to take into account the particular financial conditions, investment objectives or requirements of individual customers. Before acting on this material, you should consider whether it is suitable for your particular circumstances and, as necessary, seek professional advice.
The views and opinions expressed herein are those of the author and do not necessarily reflect the views of Interactive Brokers, its affiliates, or its employees.
Disclosure: Options Trading
Options involve risk and are not suitable for all investors. Multiple leg strategies, including spreads, will incur multiple commission charges. For more information read the "Characteristics and Risks of Standardized Options" also known as the options disclosure document (ODD) or visit ibkr.com/occ


