


Wall Street analysts are too bullish on third quarter earnings expectations for most S&P 500 companies. Although down from record highs set in recent quarters, the percent of S&P 500 companies whose Street EPS exceed our Core EPS remains high at 68%.
This report shows:
- the frequency and magnitude of overstated Street Earnings [1] in the S&P 500
- five S&P 500 companies with overstated Street estimates likely to miss 3Q22 earnings
Get our report on the S&P 500 companies more likely to beat 3Q22 Street EPS estimates here.
Street Overstates EPS for 340 S&P 500 Companies
340 companies with overstated Street Earnings make up 73% of the market cap of the S&P 500 through 8/12/22, measured on a rolling four quarter basis. For comparison, 333 companies representing 70% of the S&P 500 market cap had overstated Street Earnings in the previous quarter.
Figure 1: Overstated Street Earnings as % of Market Cap: 2012 through 8/12/22
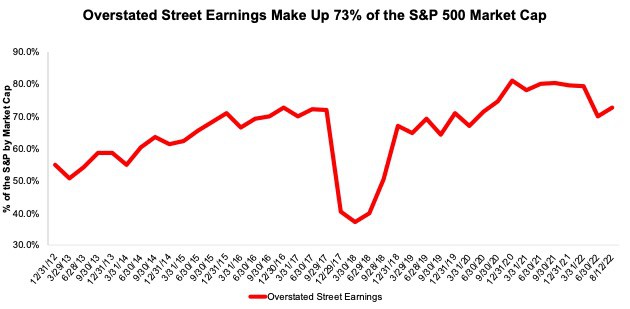
Sources: New Constructs, LLC and company filings.
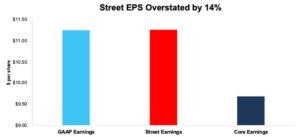
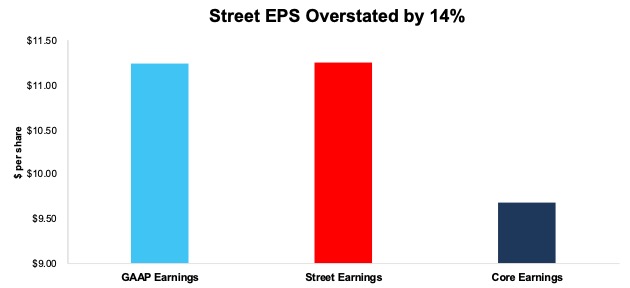
When Street Earnings overstate Core Earnings[2] they do so by an average of 19%, per Figure 2. For over a third of the S&P 500 (186 companies), Street Earnings overstate Core Earnings by more than 10%.
Figure 2: Street Earnings Overstated by 19% on Average in TTM Through 2Q22[3]
![Figure 2: Street Earnings Overstated by 19% on Average in TTM Through 2Q22[3]](https://ibkrcampus.com/wp-content/uploads/2022/10/NewConstructs_SP500OverstatedStreetEarnings_TTM2Q22.jpg)
Sources: New Constructs, LLC and company filings.
Five S&P 500 Companies Likely to Miss 3Q22 Earnings
Figure 3 shows five S&P 500 companies likely to miss calendar 3Q22 earnings because their Street EPS estimates are overstated. Below, we detail the hidden and reported unusual items that caused Street Distortion and overstated Street Earnings in the TTM ended 2Q22 for Twitter (TWTR) and Netflix (NFLX). Because investors and analysts tend to anchor their earnings projections to historical results, differences between historical Core Earnings and other measures of earnings drive differences in estimates.
Figure 3: Five S&P 500 Companies Likely to Miss 3Q22 EPS Estimates
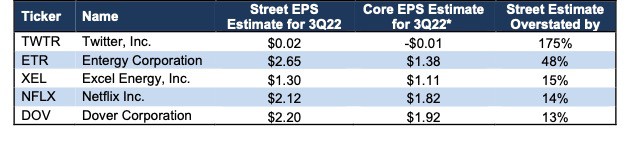
Sources: New Constructs, LLC, company filings, and Zacks
*Assumes Street Distortion as a percent of Core EPS is same for 3Q22 EPS as for TTM ended 2Q22.
Twitter Inc: The Street Overstates Earnings for 3Q22 by 175%
The Street’s 3Q22 EPS estimate of $0.02/share for Twitter overstates our estimate for 3Q2 Core EPS of -$0.01/share by $0.03/share. The inclusion of gains on Twitter’s sale of its MoPub business in January 2022 in historical Street EPS drive the difference between Street and Core EPS estimates and leads us to consider Twitter as one of the S&P 500 companies most likely to miss Wall Street’s expectations. Twitter’s Earnings Distortion Score is Miss and its Stock Rating is Unattractive.
However, it’s important to note that Twitter’s missing earnings may not impact the stock as much as others, given it is trading more on acquisition news than fundamentals.
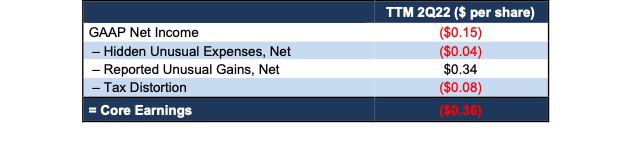
Below we detail the unusual gains that materially increased Twitter’s TTM 2Q22 Street and GAAP earnings. After removing all unusual items, we find that Twitter’s TTM 2Q22 Core EPS are -$0.36/share, which is worse than TTM 2Q22 Street EPS of -$0.13/share and GAAP EPS of -$0.15/share.
Figure 4: Comparing Twitter’s GAAP, Street, and Core Earnings: TTM Through 2Q22
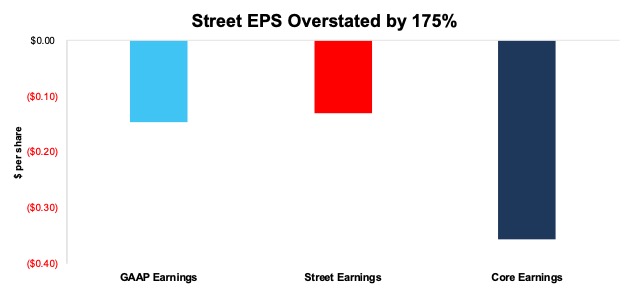
Sources: New Constructs, LLC and company filings.
We detail the differences between Core Earnings and GAAP Earnings so readers can audit our research. We would be happy to reconcile our Core Earnings with Street Earnings but cannot because we do not have the details on how analysts calculate their Street Earnings.
Figure 5 details the differences between Twitter’s Core Earnings and GAAP Earnings.
Figure 5: Twitter’s GAAP Earnings to Core Earnings Reconciliation: TTM Through 2Q22
Sources: New Constructs, LLC and company filings.
More details:
Total Earnings Distortion of $0.21/share, which equals $161 million, is comprised of the following:
Hidden Unusual Expenses, Net = -$0.04/per share, which equals -$34 million and is comprised of
- -$33 million in transaction expenses associated with the proposed merger in the 2Q22 10-Q
- -$6 million in severance related costs based on -$3 million bundled with sales and marketing expense and -$3 million bundled with general and administrative expense in the 2Q22 10-Q
- $5 million in sublease income in the TTM period based on $10 million in sublease income in the 2021 10-K
Reported Unusual Gains, Net = $0.34/per share, which equals $257 million and is comprised of
- $970 million gain in the TTM based on a sale of an asset group in 1Q22 stemming from Twitter’s sale of its MoPub business to AppLovin Corporation
- $52 million in other income in the TTM period based on
- $18 million in income in 2Q22
- -$7 million in expense in 1Q22
- $21 million in income in 4Q21
- $21 million in income in 3Q21
- $766 million in litigation settlement expenses in the TTM period based on a settlement in 3Q21
Tax Distortion = -$0.08/per share, which equals -$62 million
The similarities between Street Earnings and GAAP Earnings for Twitter indicates that Street Earnings miss many of the unusual items in GAAP Earnings, and the Street Distortion highlights that Core Earnings include a more comprehensive set of unusual items when calculating Twitter’s true profitability.
Netflix (NFLX): The Street Overstates Earnings for 3Q22 by $0.30/share
The Street’s 3Q22 EPS estimate of $2.12/share for Netflix overstates our estimate of $1.82/share by $0.30/share, largely due to “other income” included in historical Street EPS.
The magnitude of the difference between the Street and Core EPS estimates leads us to consider Netflix one of the S&P 500 companies most likely to miss Wall Street analyst’s expectations in its 3Q22 earnings report. Netflix’s Earnings Distortion Score is Miss. See our 22 other reports on Netflix here.
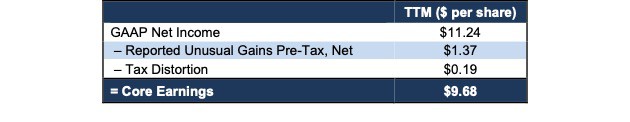
Below, we detail the unusual gains that materially increased Netflix’s TTM 2Q22 Street and GAAP earnings. After removing all unusual items, we find that Netflix’s TTM 2Q22 Core EPS are $9.68/share, which is worse than TTM 2Q22 Street EPS of $11.25/share and GAAP EPS of $11.24/share.
Figure 6: Comparing Netflix’s GAAP, Street, and Core Earnings: TTM Through 2Q22
Sources: New Constructs, LLC and company filings.
We detail the differences between Core Earnings and GAAP Earnings so readers can audit our research. We would be happy to reconcile our Core Earnings with Street Earnings but cannot because we do not have the details on how analysts calculate their Street Earnings.
Figure 7 details the differences between Netflix’s Core Earnings and GAAP Earnings.
Figure 7: Netflix GAAP Earnings to Core Earnings Reconciliation: TTM Through 2Q22
Sources: New Constructs, LLC and company filings.
More details:
Total Earnings Distortion of $1.56/share, which equals $705 million, is comprised of the following:
Reported Unusual Gains Pre-Tax, Net = $1.37/per share, which equals $621 million and is comprised of
- $621 million in interest and other income in the TTM period based on
- $220 million in 2Q22
- $196 million in 1Q22
- $109 million in 4Q21
- $96 million in 3Q21
Tax Distortion = $0.19/per share, which equals $85 million
Netflix notes in the MD&A of its filings that interest and other income consists primarily of foreign exchange gains and losses on foreign currency denominated balances and interest earned on cash and equivalents.
Given the similarities between Street Earnings and GAAP Earnings for Netflix, our research shows Street and GAAP earnings both fail to capture unusual items reported on the income statement, and further broken out in the MD&A of Netflix’s filings and therefore give a misleading picture of the firm’s profitability.
—
This article originally published on October 7, 2022.
Disclosure: David Trainer, Kyle Guske II, and Matt Shuler receive no compensation to write about any specific stock, style, or theme.
Follow us on Twitter, Facebook, LinkedIn, and StockTwits for real-time alerts on all our research.
[1] Street Earnings refer to Zacks Earnings, which are reported to be adjusted to remove non-recurring items using standardized assumptions from the sell-side.
[2] The Journal of Financial Economics features the superiority of our Core Earnings in Core Earnings: New Data & Evidence.
[3] Average overstated % is calculated as Street Distortion, which is the difference between Street Earnings and Core Earnings.
Click here to download a PDF of this report.
Disclosure: New Constructs
David Trainer, Kyle Guske II, Sam McBride, Matt Shuler, Alex Sword, and Andrew Gallagher receive no compensation to write about any specific stock, style, or theme.
The information and opinions presented in this report are provided to you for information purposes only and are not to be used or considered as an offer or solicitation of an offer to buy or sell securities or other financial instruments. New Constructs has not taken any steps to ensure that the securities referred to in this report are suitable for any particular investor and nothing in this report constitutes investment, legal, accounting or tax advice. This report includes general information that does not take into account your individual circumstance, financial situation or needs, nor does it represent a personal recommendation to you. The investments or services contained or referred to in this report may not be suitable for you and it is recommended that you consult an independent investment advisor if you are in doubt about any such investments or investment services.
Information and opinions presented in this report have been obtained or derived from sources believed by New Constructs to be reliable, but New Constructs makes no representation as to their accuracy, authority, usefulness, reliability, timeliness or completeness. New Constructs accepts no liability for loss arising from the use of the information presented in this report, and New Constructs makes no warranty as to results that may be obtained from the information presented in this report. Past performance should not be taken as an indication or guarantee of future performance, and no representation or warranty, express or implied, is made regarding future performance. Information and opinions contained in this report reflect a judgment at its original date of publication by New Constructs and are subject to change without notice. New Constructs may have issued, and may in the future issue, other reports that are inconsistent with, and reach different conclusions from, the information presented in this report. Those reports reflect the different assumptions, views and analytical methods of the analysts who prepared them and New Constructs is under no obligation to insure that such other reports are brought to the attention of any recipient of this report.
New Constructs’ reports are intended for distribution to its professional and institutional investor customers. Recipients who are not professionals or institutional investor customers of New Constructs should seek the advice of their independent financial advisor prior to making any investment decision or for any necessary explanation of its contents.
In-depth risk/reward analysis underpins our stock rating. Our stock rating methodology grades every stock according to what we believe are the 5 most important criteria for assessing the quality of a stock. Each grade reflects the balance of potential risk and reward of buying that stock. Our analysis results in the 5 ratings described below. Very Attractive and Attractive correspond to a “Buy” rating, Very Unattractive and Unattractive correspond to a “Sell” rating, while Neutral corresponds to a “Hold” rating.
Disclosure: Interactive Brokers
Information posted on IBKR Campus that is provided by third-parties does NOT constitute a recommendation that you should contract for the services of that third party. Third-party participants who contribute to IBKR Campus are independent of Interactive Brokers and Interactive Brokers does not make any representations or warranties concerning the services offered, their past or future performance, or the accuracy of the information provided by the third party. Past performance is no guarantee of future results.
This material is from New Constructs and is being posted with its permission. The views expressed in this material are solely those of the author and/or New Constructs and Interactive Brokers is not endorsing or recommending any investment or trading discussed in the material. This material is not and should not be construed as an offer to buy or sell any security. It should not be construed as research or investment advice or a recommendation to buy, sell or hold any security or commodity. This material does not and is not intended to take into account the particular financial conditions, investment objectives or requirements of individual customers. Before acting on this material, you should consider whether it is suitable for your particular circumstances and, as necessary, seek professional advice.


