


It appears that call options have become nearly as catchy among individual investors as an earworm pop song. A recent Wall Street Journal article highlights the surge in options volumes in Tesla (TSLA), Amazon (AMZN) and other popular tech stocks. Traders at IBKR are no exception, as we see high options volume in TSLA, Nvidia (NVDA), AMD and many others. We discussed this phenomenon on Monday, when we went into detail about how the options market might be influenced by the moves in the underlying shares of TSLA. Today we will take a more granular look at how the call options activity is being reflected in skew – the result of plotting the implied volatilities of options with a given expiry across a range of strikes.[1]
It stands to reason that if there is outsized demand for options they will sport higher implied volatilities. Changing implied volatility is the primary way that options market makers respond to order flow. When we think about the main inputs to options prices, market makers have no control over the underlying price of the stock, prevailing interest rates, dividends, or the like. Instead, they can quickly raise or lower the implied volatility assumptions in their pricing model. High demand leads to higher implied vols, and vice versa.
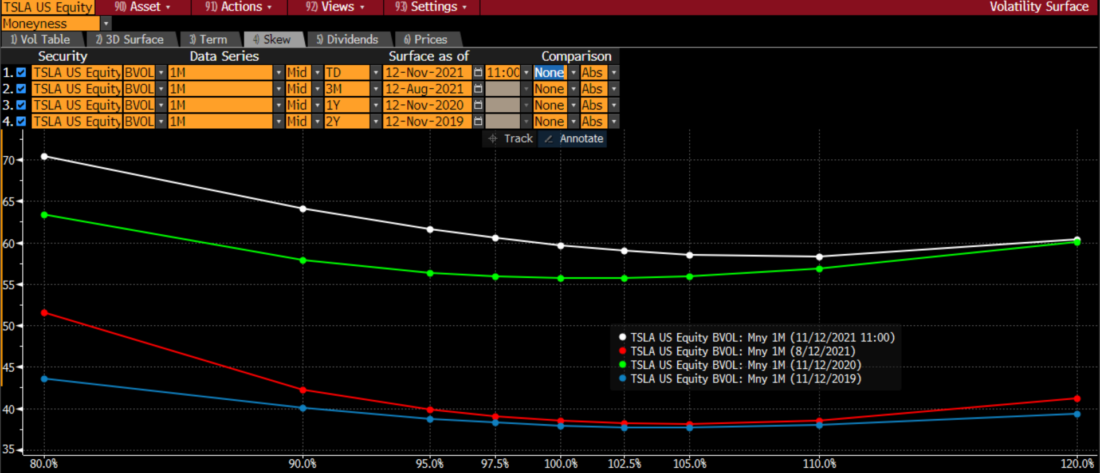
We would therefore expect to see steepening skews in TSLA and even the NASDAQ 100 Index (NDX). Remember that NDX is quite top-heavy, with the top 7 companies representing about 50% of the market-capitalization. If there is high demand for out of the money call options in those companies, we would expect to see it also reflected in the options of the index that most closely tracks them. The following graphs should reflect that demand. They show the skews of TSLA and NDX options at various times.
TSLA Skew 1-Month Options, Today (white), 3 Months Ago (red), 1 Year Ago (green), 2 Years Ago (blue)
Source: Bloomberg
NDX Skew 1-Month Options, Today (white), 3 Months Ago (red), 1 Year Ago (green), 2 Years Ago (blue)

Source: Bloomberg
We chose the timeframes to reflect varied periods in the acceptance of options among individual investors. Investor mentality wasn’t all that different 3 months ago, but if there was indeed a change over that time it would be apparent. One year ago, investors were warming to call options even in the wake of Softbank’s ill-fated foray into tech stock options, while two years ago represents a time before fiscal stimulus and the recent embrace of investing by the general public.
The graphs show that skews have been quite consistent over the various timeframes. There are of course shifts in the levels of the skew curves, but they have been more or less parallel. Interestingly, the steepest skew toward NDX calls was two years ago, when the overall level of implied volatility was lowest. The relative demand for 20% out of the money versus at-money calls was highest at that time. Meanwhile, we have only recently seen an increased demand for protective puts in TSLA. That is likely more related to Elon Musk’s stock sales and Tuesday’s 10% drop.
One might ask whether 1 month options are the best indicator for these stocks. Traders have been gravitating toward weekly options as they try to surf the stock moves while minimizing time premia. There is some evidence of changing skew there, but still not substantial:
TSLA Skew 1-Week Options, Today (white), 3 Months Ago (red), 1 Year Ago (green), 2 Years Ago (blue)

Source: Bloomberg
NDX Skew 1-Week Options, Today (white), 3 Months Ago (red), 1 Year Ago (green), 2 Years Ago (blue)

Source: Bloomberg
How then do we reconcile this love for call options with the relatively stable skew? I believe that the answer lies with open interest. Remember that an option is created, seemingly out of thin air, when a buyer and a seller meet and neither side already has a position. An option vanishes when both sides of a trade close their positions. The outstanding positions are compiled at the end of the day and reported as of the close of business.
It is striking (no pun intended), that the volume in the most actively traded options dwarfs their open interest. For example, this morning’s open interest in the TSLA 1100 strike calls that expire today was a robust 14,266. Yet 69,322 contracts traded on that line yesterday. The ratio is similar in a wide array of popular strikes. That indicates that the vast majority of contracts were opened and closed on an intraday basis. Quite clearly, the bulk of the options are being “rented” by day traders, not positioned overnight. To be fair, that avoids the overnight decay that eats away on options, particularly those that are nearing expiration, but it is a sign that the bulk of the trading in popular options is purely speculative.
How does this end? More likely not with a bang, but with a whimper. The appeal of call options as a speculative tool stems from theIr ability to offer traders a leveraged bet on an underlying stock with a defined loss. If markets turn lower, meaning that these wagers fail, traders should lose relatively small amounts of money on each call. It will take a series of losing wagers to change their behavior. In the meantime, on a day when equity markets can shoot higher in spite of (or because of?) dire Consumer Confidence readings, call speculators remain emboldened.
[i] A more detailed explanation of options skew can be found here: Options Skews Are, Well, Skewed – Traders’ Insight (tradersinsight.news)
Disclosure: Interactive Brokers
The analysis in this material is provided for information only and is not and should not be construed as an offer to sell or the solicitation of an offer to buy any security. To the extent that this material discusses general market activity, industry or sector trends or other broad-based economic or political conditions, it should not be construed as research or investment advice. To the extent that it includes references to specific securities, commodities, currencies, or other instruments, those references do not constitute a recommendation by IBKR to buy, sell or hold such investments. This material does not and is not intended to take into account the particular financial conditions, investment objectives or requirements of individual customers. Before acting on this material, you should consider whether it is suitable for your particular circumstances and, as necessary, seek professional advice.
The views and opinions expressed herein are those of the author and do not necessarily reflect the views of Interactive Brokers, its affiliates, or its employees.
Disclosure: Options Trading
Options involve risk and are not suitable for all investors. Multiple leg strategies, including spreads, will incur multiple commission charges. For more information read the "Characteristics and Risks of Standardized Options" also known as the options disclosure document (ODD) or visit ibkr.com/occ


