


By Mark Barnes, head of investment research (Americas), and Christine Haggerty, global investment research
Though the euphoria earlier this year has cooled with the dimming hopes for a V-shaped global economic recovery, equity markets have still marshalled periodic risk-on upsurges, most recently in late August.
In the US, these shifts in risk appetite have played out most vividly in the tug of war between small- and large-cap stocks, and well as between the industries that dominate each index: financials and technology, respectively.
Since badly lagging in Q1, the Russell 1000 has been on a steady winning streak, overtaking the Russell 2000 in July and then sprinting even higher until recently. For the year through August-end, the large-cap index amassed a four-percentage-point lead over the small-cap index (20.7% vs 15.8%, respectively). Large vs small-cap leadership has fluctuated mainly with shifts in global recovery expectations and long-dated US Treasury yields.
YTD 2021 returns ‒ Russell 1000 relative to Russell 2000 (TR, rebased)
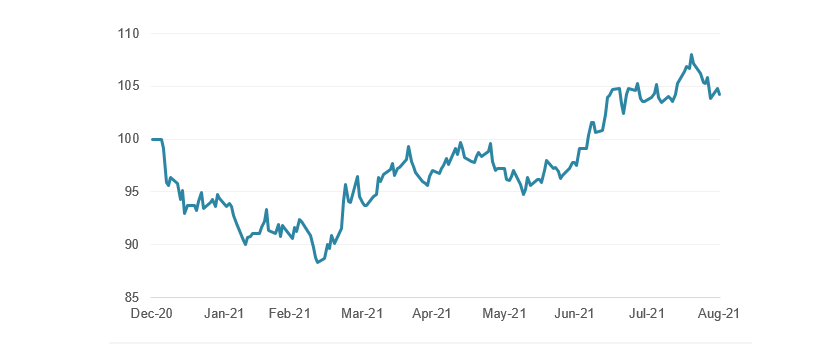
Source: FTSE Russell. Data through August 31, 2021. Past performance is no guarantee to future results. Please see the end for important disclosures.
Reflation trade 2.0?
In its early stages, the reflation trade fueled robust rotations into cheap, small-cap and economically sensitive stocks most likely to get a lift from the strong reopening tailwinds and soaring commodity prices, notably financials, energy, basic materials and consumer discretionary. Large-cap growth-oriented stocks, notably technology, underperformed.
But as macro growth worries rose, the list of risk-on beneficiaries narrowed: Financials have tended to outperform during periods of rising long bond yields, given the positive implications for industry profitability. However, earlier rallies in energy and basic materials stocks have lost momentum with the recent retreat in commodity prices.
YTD 2021 returns ‒ R1000 and R2000 ICB Financials vs Technology (rebased)
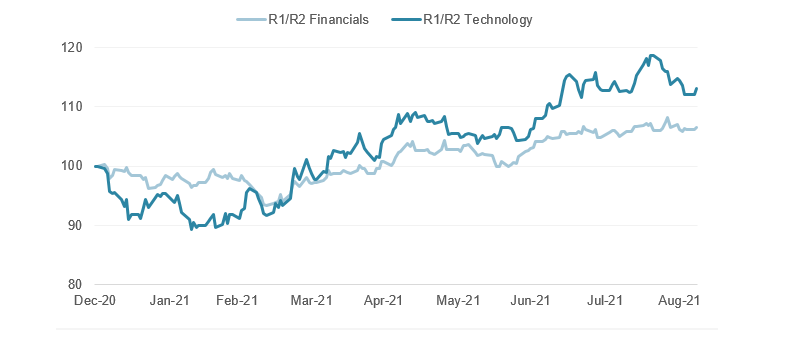
Source: FTSE Russell. Data through September 7, 2021. Past performance is no guarantee of future results. Please see the end for important legal disclosures.
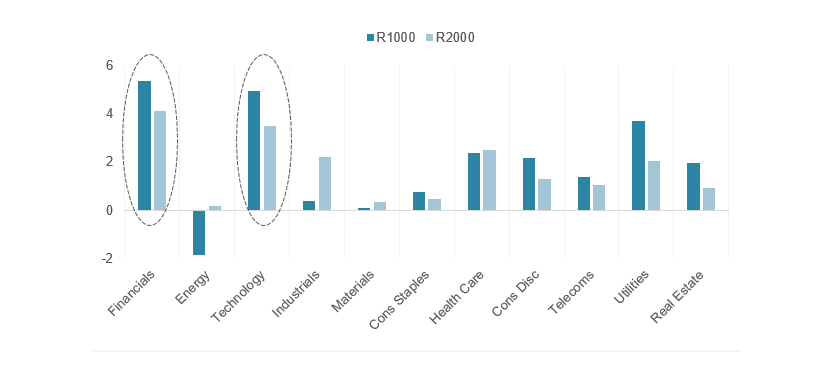
As the industry return comparisons below show, Russell 1000’s performance edge this year has come predominately from strong gains in large-cap technology, financials and real estate and significantly smaller losses in health care. Technology dominates the Russell 1000’s industry exposures, with an overweight more than twice that of its small-cap counterpart.
The Russell 2000’s strength has also been concentrated in financials, as well as cyclically sensitive energy, basic materials and consumer discretionary stocks, which represent sizable overweights versus the large-cap index.
YTD 2021 ICB industry returns relative to Russell 1000 and Russell 2000 (% difference)
Source: FTSE Russell. Data as of August 31, 2021. Past performance is no guarantee of future results. Please see the end for important legal disclosures.
August whiplash offers directional cues
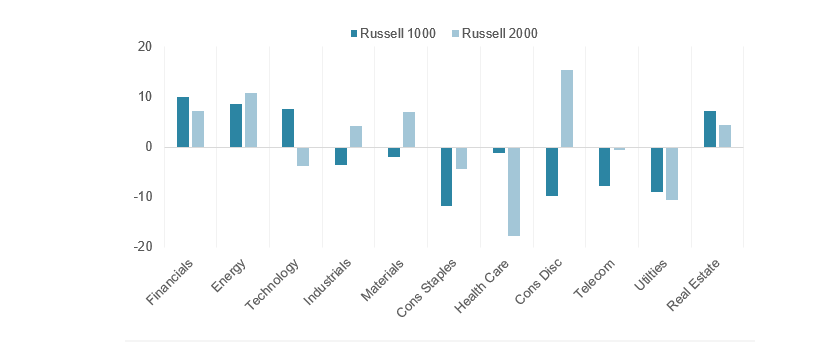
Industry performances in August are illuminating. As the industry returns below show, financials in both indexes led gains for the month, as the uptick in long bond yields and modest steepening of the yield curve early in the month lifted the profit prospects for banks and insurers. Unlike in the Q1 risk rally, energy and basic materials stocks hugged the bottom of the performance list.
Tech stocks performed nearly as strongly as financials, but most of those gains came in the last two weeks of the month as waning recovery optimism weighed on long bond yields again and stirred greater appreciation for companies offering reliable earnings growth and healthy balance sheets.
August 2021 – Industry Classification Benchmark (ICB) total returns
Source: FTSE Russell. Data as of August 31, 2021. Past performance is no guarantee of future results. Please see the end for important legal disclosures.
Given lingering uncertainties overhanging the global health, policy and economic outlook, financial markets are likely to remain unsettled in the months ahead. Shifts among equity winners and losers and the macro prospects driving them hold important clues for negotiating the investment environment ahead.
—
Originally Posted on September 20, 2021 – Financials and Tech Stocks Vie for Dominance in Risk-On/Risk-Off Battle
Disclosure: FTSE Russell
Interactive Advisors, a division of Interactive Brokers Group, offers FTSE Russell Index Tracker portfolios on its online investing marketplace. Learn more about the Diversified Portfolios.
This material is not intended as investment advice. Interactive Advisors or portfolio managers on its marketplace may hold long or short positions in the companies mentioned through stocks, options or other securities.
© 2023 London Stock Exchange Group plc and its applicable group undertakings (the “LSE Group”). The LSE Group includes (1) FTSE International Limited (“FTSE”), (2) Frank Russell Company (“Russell”), (3) FTSE Global Debt Capital Markets Inc. and FTSE Global Debt Capital Markets Limited (together, “FTSE Canada”), (4) MTSNext Limited (“MTSNext”), (5) Mergent, Inc. (“Mergent”), (6) FTSE Fixed Income LLC (“FTSE FI”), (7) The Yield Book Inc (“YB”) and (8) Beyond Ratings S.A.S. (“BR”). All rights reserved.
FTSE Russell® is a trading name of FTSE, Russell, FTSE Canada, MTSNext, Mergent, FTSE FI, YB and BR. “FTSE®”, “Russell®”, “FTSE Russell®”, “MTS®”, “FTSE4Good®”, “ICB®”, “Mergent®”, “The Yield Book®”, “Beyond Ratings®“ and all other trademarks and service marks used herein (whether registered or unregistered) are trademarks and/or service marks owned or licensed by the applicable member of the LSE Group or their respective licensors and are owned, or used under licence, by FTSE, Russell, MTSNext, FTSE Canada, Mergent, FTSE FI, YB or BR. FTSE International Limited is authorised and regulated by the Financial Conduct Authority as a benchmark administrator.
All information is provided for information purposes only. All information and data contained in this publication is obtained by the LSE Group, from sources believed by it to be accurate and reliable. Because of the possibility of human and mechanical error as well as other factors, however, such information and data is provided “as is” without warranty of any kind. No member of the LSE Group nor their respective directors, officers, employees, partners or licensors make any claim, prediction, warranty or representation whatsoever, expressly or impliedly, either as to the accuracy, timeliness, completeness, merchantability of any information or of results to be obtained from the use of the FTSE Russell products, including but not limited to indexes, data and analytics or the fitness or suitability of the FTSE Russell products for any particular purpose to which they might be put. Any representation of historical data accessible through FTSE Russell products is provided for information purposes only and is not a reliable indicator of future performance.
No responsibility or liability can be accepted by any member of the LSE Group nor their respective directors, officers, employees, partners or licensors for (a) any loss or damage in whole or in part caused by, resulting from, or relating to any error (negligent or otherwise) or other circumstance involved in procuring, collecting, compiling, interpreting, analysing, editing, transcribing, transmitting, communicating or delivering any such information or data or from use of this document or links to this document or (b) any direct, indirect, special, consequential or incidental damages whatsoever, even if any member of the LSE Group is advised in advance of the possibility of such damages, resulting from the use of, or inability to use, such information.
No member of the LSE Group nor their respective directors, officers, employees, partners or licensors provide investment advice and nothing contained herein or accessible through FTSE Russell products, including statistical data and industry reports, should be taken as constituting financial or investment advice or a financial promotion.
Past performance is no guarantee of future results. Charts and graphs are provided for illustrative purposes only. Index returns shown may not represent the results of the actual trading of investable assets. Certain returns shown may reflect back-tested performance. All performance presented prior to the index inception date is back-tested performance. Back-tested performance is not actual performance, but is hypothetical. The back-test calculations are based on the same methodology that was in effect when the index was officially launched. However, back- tested data may reflect the application of the index methodology with the benefit of hindsight, and the historic calculations of an index may change from month to month based on revisions to the underlying economic data used in the calculation of the index.
This document may contain forward-looking assessments. These are based upon a number of assumptions concerning future conditions that ultimately may prove to be inaccurate. Such forward-looking assessments are subject to risks and uncertainties and may be affected by various factors that may cause actual results to differ materially. No member of the LSE Group nor their licensors assume any duty to and do not undertake to update forward-looking assessments.
No part of this information may be reproduced, stored in a retrieval system or transmitted in any form or by any means, electronic, mechanical, photocopying, recording or otherwise, without prior written permission of the applicable member of the LSE Group. Use and distribution of the LSE Group data requires a licence from FTSE, Russell, FTSE Canada, MTSNext, Mergent, FTSE FI, YB, BR and/or their respective licensors.
Disclosure: Interactive Brokers
Information posted on IBKR Campus that is provided by third-parties does NOT constitute a recommendation that you should contract for the services of that third party. Third-party participants who contribute to IBKR Campus are independent of Interactive Brokers and Interactive Brokers does not make any representations or warranties concerning the services offered, their past or future performance, or the accuracy of the information provided by the third party. Past performance is no guarantee of future results.
This material is from FTSE Russell and is being posted with its permission. The views expressed in this material are solely those of the author and/or FTSE Russell and Interactive Brokers is not endorsing or recommending any investment or trading discussed in the material. This material is not and should not be construed as an offer to buy or sell any security. It should not be construed as research or investment advice or a recommendation to buy, sell or hold any security or commodity. This material does not and is not intended to take into account the particular financial conditions, investment objectives or requirements of individual customers. Before acting on this material, you should consider whether it is suitable for your particular circumstances and, as necessary, seek professional advice.


