


- Globally, the Bank Sector has been among the strongest performing stock sectors in the 2021 YTD, generating similar returns to the Energy Sector. In Singapore, DBS, OCBC and UOB, which have ranked amongst the 10 largest ASEAN bank stocks over the past 20 years, have averaged 23% total returns in the 2021 YTD.
- Interest rate expectations have been a key driver of international bank stocks in 2021. From the 22 Sep FOMC through to 13 October, the 2/10 US yield curve steepened 17 bps while, with the Bloomberg World Banks Index gaining 4.4% in SGD terms, and DBS gaining 4.1%, OCBC gaining 4.0% and UOB gaining 4.9%.
- While the trio of DBS, OCBC and UOB have seen similar long term 20 year returns, with international sector trends, regional growth and digitalisation among common drivers, increased economic normalisation in 2021 has seen more recent variances in net institutional flows and comparative returns.
While the FTSE Asia Pacific Index has generated a 3% total return in the 2021 year-to-date, ASEAN’s 10 largest bank stocks by market value have averaged 14% gains. Total returns of these 10 bank stocks for the 41 weeks ranged from 36% for Thailand’s Siam Commercial Bank Pub Co to 3% gains for Vietnam’s Bank for Foreign Trade JSC. Longer term, ASEAN banks have maintained critical roles in financially facilitating the economic growth of the region, which has seen combined GDP increase from ~US$600 billion in 2001 to ~US$2.5 trillion in 2016, to above US$3.0 trillion in 2021.
ASEAN Bank Sector Expanded 7-Fold over the Past 20 years
ASEAN banking stocks make up the majority of the regional Financial Sector, with the combined market value of ASEAN bank stocks increasing from just over S$100 billion in October 2001, to near S$500 billion in October 2016 to above S$750 billion today.
ASEAN’s 10 largest banks by market value have averaged 75% total returns since October 2016, led by Vietnam’s Bank For Foreign Trade JSC, Singapore’s DBS and Indonesia’s Bank Central Asia Tbk PT. These 10 banks alone maintain a combined market value of S$445 billion, representing close to 50% of the combined value of ASEAN’s financial stocks. Like October 2016, the present median premium to book value of the 10 largest ASEAN bank stocks is near 50%, with the three aforementioned banks seeing the greatest increase in their price-to-book ratios over the five years. As many as nine of the 10 Banks also outpaced the broader FTSE ASEAN All-Share Index over the five years (ending 12 Oct):
- In Singapore, DBS, Oversea-Chinese Banking Corp (“OCBC”) and United Overseas Bank (“UOB”) averaged 95% returns;
- In Indonesia, Bank Central Asia Tbk Pt, Bank Mandiri Persero Tbk Pt and Bank Rakyat Indonesia Perser averaged 83% total returns;
- Malaysia’s Public Bank Berhad and Malayan Banking Berhad averaged 34% total returns; and
- Thailand’s Siam Commercial Bank Pub Co generated a 15% total return as Vietnam’s Bank for Foreign Trade JSC outpaced with 161% total returns.
Five of the 10 banks were also among ASEAN’s 10 largest banks by market value back in October 2001 – DBS Group Holdings, Oversea-Chinese Banking Corp, United Overseas Bank, Public Bank Berhad and Malayan Banking Berhad, while Bank Central Asia Tbk Pt was then ranked among the top 20 banks and Siam Commercial Bank Pub Co ranked among the top 30 banks. Bank Mandiri Persero Tbk Pt and Bank Rakyat Indonesia Perser both listed in 2003 while Vietnam’s Bank For Foreign Trade JSC listed in 2007.
DBS, OCBC and UOB generated very similar average annualised total returns over the past 20 years, at 10.0%, 9.6% and 9.1% respectively. Nonetheless there have been a number of globally-driven occasions, particularly in recent years, that have provided cues for shorter-term trading. The trio of DBS, OCBC and UOB also make up 20% of the total market cap of all stocks listed on SGX, in addition to 20% of the day-to-day turnover, the three banks make up more than 40% of the STI.
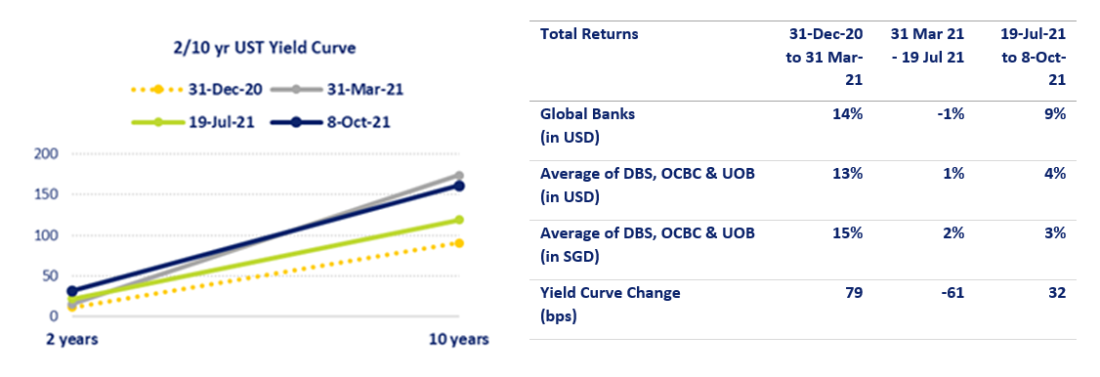
Source: SGX, Refinitiv & Bloomberg. Note the chart on the left shows the 2/10 year UST yield curves at the four dates. The left axis represents the interest rates in basis points (“bps”). On the 8 October the 2/10 UST year was at 129 bps, with 2 year UST yields at 32 bps and 10 year UST yields ay 161 bps.
Since 1Q21, the United States has seen increased mixed signals in high frequency economic data ultimately impacted by COVID-led demand constraints and supply restraints. At the same time, there have been loud and clear, albeit diverse views on growth and inflation by Federal Reserve participants who have been encouraged by the Fed Chair to speak up on account of added transparency to the market. This has seen the 2/10 year UST yield curve average steepening or flattening by as much as 25 bps within each of the past six months (for instance, in September the curve steepened 20 bps, from lows of 105 bps on 15 Sep, to highs 125 bps on 28 Sep). The 25 bps average monthly amplitude in the 2/10 yield curve since 1Q21 was two-thirds higher than the average 14 bps amplitude in in 2019. This increased tempo in interest rate expectations, evident in the swings of the US yield curve has also seen DBS and OCBC average 13% greater daily amplitude between high and low for the six months ending September compared to pre-COVID levels in 2019. UOB, on the other hand has seen a 6% decline in its daily amplitude compared to its comparatively high based 2019 levels.
Nonetheless, all three banks have averaged daily trading ranges in the vicinity of 1.2% for the past six months. As tabled above, the banks have also shown directional correlation with the swings of global banks as the 2/10 year UST yield curve steepened from 79 bps at the end of 2020 to 158 bps on 31 March 2021, before flattening to 97 bps on 19 July, and then steepening to 129 bps on 8 October. The 2/10 year UST yield curve is presently at 123 bps with growth and inflation outlooks the key push and pull driver. Already this month, Minneapolis Fed President, Neel Kashkari has maintained that the US job market still has a long way to go before healing, while St Louis Fed President James Bullard has stated that US businesses are saying ‘don’t worry my company’s going to be profitable because I am going to raise prices and we’ve had no difficulty raising prices in this environment’.
The most recent FOMC meeting confirmed tapering would likely start in 4Q21 on 22 September, and through to 13 October, the 2/10 US yield curve steepened 17 bps while, the Bloomberg World Banks Index gained 4.5% in SGD terms, DBS gained 4.1%, OCBC gained 4.0% and UOB gained 4.9%.
DBS, OCBC & UOB Averaged 46% YoY 2QFY21 Net Profit Growth
For their 2QFY21 (ended 30 June) DBS, OCBC and UOB respectively reported their net profit grew 37%, 59% and 43% from 2QFY20. UOB will provide a 3QFY21 business update on 3 November, DBS will report 3QFY21 results on 5 November, with OCBC also expected to report that week.
On the Interest side of the business, in 2QFY21, DBS, OCBC and UOB reported combined Net Interest Income (“NII”) of S$5.13 billion, which was up 1% from S$5.08 billion in 1QFY21. For the trio this was the highest QoQ increase in combined NII since the QoQ increase in 3QFY19.
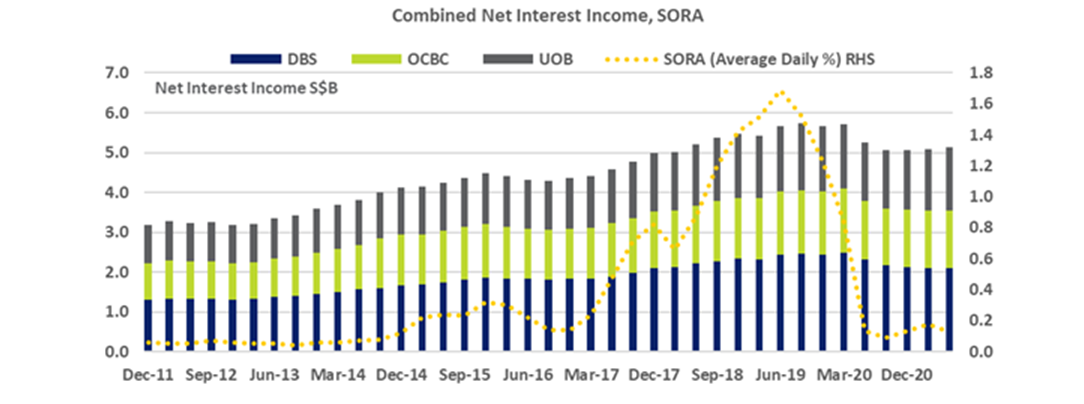
Compared to 2QFY20, the 2QFY21 NII growth was led by UOB, whose NII was up 8% YoY from 2QFY20, whilst the NII for DBS and UOB decreased YoY. The NII YoY growth for UOB also saw UOB post an increase a YoY increase in total income for its 2QFY21 at 7%, while DBS total income declined 4% YoY and OCBC total income declined 2% YoY. All three banks reported a YoY increase in their loan books in 2QFY21, with UOB leading the YoY growth with a 6% YoY increase in its loan growth.
For capital adequacy, as of 30 June, OCBC maintained a Common Equity Tier 1 (“CET-1”) ratio of 16.1%, with DBS at 14.5% and UOB at 14.2%. The Non-Performing Loan (“NPL”) ratio stood at 1.5% in 2QFY21, for DBS, OCBC and UOB.
Key growth drivers for the trio include increased digitalisation, the broadening of wealth management services, and a continued focus on supply chains and growth markets. As noted above, the trio banks are an important part of the ASEAN Bank Sector. In 1HFY21, UOB noted the profit before tax for its Malaysia segment declined 6% YoY to S$281 million from general allowance while more than doubling from 2HFY20 on lower credit costs, with Thailand profit before tax rebounding by 154% YoY to S$150 million, primarily due to lower general allowance, and Indonesia profit before tax increasing 80% YoY to S$42 million, mainly from higher net interest income and lower credit costs.
Combined wealth management net fee and commission income for DBS, OCBC and UOB has almost tripled from near S$700 million in 1HFY14 to close to S$2.0 billion in 1HFY21. In 1HFY21, 9.7% of UOB’s net revenues were reported to Greater China, with OCBC reporting 13.6% to Greater China and DBS reporting 25% of its net revenue to Greater China, with approximately two-thirds of that 25% reported to Hong Kong.
In 1HFY21, NII made up 56% of DBS’ total income, 53% of OCBC’s total income and 63% of UOB’s total income. For 1HFY21, DBS, OCBC and UOB maintained respective annualised Return on Equity (“ROE’) of 14.0%, 10.8%, and 10.1%. By comparison, the average ROE of the Singapore banks, is higher than both the median ROE for the top quartile of global banks by market value and the median for the approximate 600 banking stocks listed across Asia Pacific.
Recent Ebb & Flows
While the trio of DBS, OCBC and UOB have seen similar long term 20 year returns, with international trends, regional growth and digitalisation among common drivers, increased economic normalisation in 2021 has seen the increased variance in net institutional flows and comparative returns. This has coincided with variations in net institutional flows since 30 June, and recent diversions and reversions in price ratio spreads.
In 1H21, DBS booked S$942 million in net institutional inflow, with OCBC booking S$487 million and UOB booking S$275 million. In 2H21 through to 12 October, DBS has booked S$48 million in net institutional outflow, OCBC has booked S$270 million in net institutional outflow, while UOB has booked S$42 million of net institutional inflow. Since 30 June, DBS, OCBC and UOB generated respective total returns of 3.4%, 1.2% and 5.3%.
For retail investors, the big moves of 2020 and early 2021 attracted a surge of retail investor flows. DBS saw close to S$2.0 billion in net retail inflows for the first three quarters of 2020, with the volume weighted average price (“VWAP”) of the stock over the nine months at S$21.01. Then, DBS saw net retail outflows of S$1.9 billion in the subsequent three quarters of the 4Q20 through to the 2Q21 with a nine-month VWAP of S$26.42.
On the shorter term changes in price-ratio spreads, relevant for more sophisticated investors, from 30 September through to 13 October, OCBC outpaced DBS, with OCBC gaining 3.0%, while DBS gained 0.6%. On 30 September, the price ratio of OCBC (S$11.50) to DBS (S$30.32) was at 0.3793, more than two standard deviations below the then rolling 12 month mean price ratio of 0.4030. This was a fresh low for this price ratio, with the price ratio last at that level in early 2007. The price ratio has since reverted to 0.3882 on the 13 October close, back to less than two standard deviations below the rolling 12 month mean of 0.4019.
While the price ratio has increased by just 2.3%, institutional investors that bought a DBS 5x Short DLC (DCAW) at 0.705 and bought an OCBC 5x Long DLC (DMUW) at 0.925 on the 30 Sep close and sold to close the respective positions on 13 October, would have done so at 0.670 and 1.055 respectively. The returns would have included a 5.0% decline on the DBS Short leg, offset by a 14.1% gain on the OCBC Long leg.
Note that Daily Leverage Certificates are for investors who are willing to accept the risk of substantial losses up to the principal investment amount, possibly within a very short timeframe. Moreover, investors should also have sufficient understanding of the product and should possess either a high level of knowledge or sufficient trading experience to properly evaluate and assess the product structure, associated risks, valuation, costs and expected returns. Also all investors need to be Specified Investment Products (SIP) qualified to invest in these instruments.
—
Originally Posted on October 13, 2021 – Key Drivers of Singapore Bank Stocks
Disclosure: Interactive Brokers
Information posted on IBKR Campus that is provided by third-parties does NOT constitute a recommendation that you should contract for the services of that third party. Third-party participants who contribute to IBKR Campus are independent of Interactive Brokers and Interactive Brokers does not make any representations or warranties concerning the services offered, their past or future performance, or the accuracy of the information provided by the third party. Past performance is no guarantee of future results.
This material is from Singapore Exchange and is being posted with its permission. The views expressed in this material are solely those of the author and/or Singapore Exchange and Interactive Brokers is not endorsing or recommending any investment or trading discussed in the material. This material is not and should not be construed as an offer to buy or sell any security. It should not be construed as research or investment advice or a recommendation to buy, sell or hold any security or commodity. This material does not and is not intended to take into account the particular financial conditions, investment objectives or requirements of individual customers. Before acting on this material, you should consider whether it is suitable for your particular circumstances and, as necessary, seek professional advice.


