


Stocks – FB, AMZN, ROKU
Macro – SPY, VIX
S&P 500 (SPY)
Stocks finished the day lower, with S&P 500 down about 1.3% and the Qs down about 2.1%. It is hard to say that sell-off is picking up steam yet, despite being down almost 5.5% from its highs. Given the size of the advance over the past year and a half, a 5.5% drop is not a big deal. The S&P 500 is now about 4% from its 200-day moving, a level that many people will watch but offers little if any support on a historical basis. The S&P 500 has generally cut right through the 200-day moving average during actual periods of market worry such as 2015/16, 2018, and 2020.
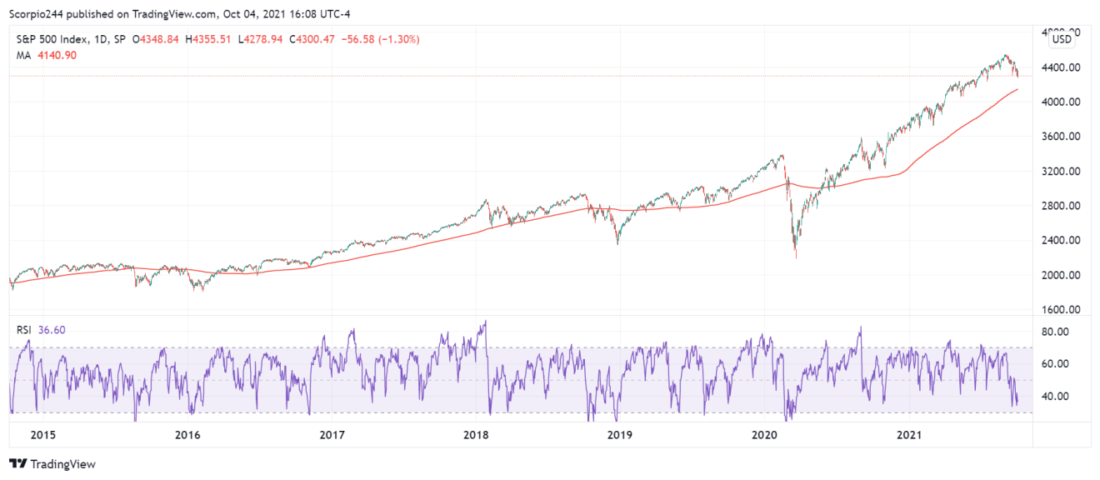
Now the 200-week moving average is a different story, with it only failing meaningful during the 2008 meltdown and the 2020 covid meltdown. But if we are heading to the 200-week moving average, we have merely brushed the decline’s surface because that average is somewhere around 3,200.

There are fundamental reasons for the recent decline in the market; this isn’t a technical adjustment being made. There are multiple issues with this market, such as high valuation, a Fed that is due to become less friendly, slowing GDP growth, slowing earnings growth, and the potential for a disappointing earnings season. Not to mention the index isn’t even oversold yet, so there is a good chance we see 4,240 in the coming days. Once we fell below 4,306 today, the index was unable to rise back above it.

From a technical standpoint, it almost appears there is a head and shoulder pattern formed in the index, with a neckline that has already broken.

VIX (VIX)
The VIX index hardly moved today, rising to 22.95. For now, the VIX appears to be settling into this 23 region, and it is interesting because it implies about a 1.5% daily move in the S&P 500. Given the recent volatility in the market, it would explain why you do not see the VIX move lower as we have seen during previous sell-offs. Additionally, it seems the VIX could be setting you for a higher spike.

Facebook (FB)
Today, we saw the selling pressure on the mega-cap names pick-up, with Facebook falling nearly 5%. I have never been a fan of Facebook, and the latest news isn’t going to help the stock. For now, support is at $325 is holding, and you have to hope that holds; otherwise, we could be looking at $315 as the next stop or, worse, $299.

Amazon (AMZN)
Amazon fell to support today at $3,200. It is an essential level for the stock, as the next level of support doesn’t come until $3,020. I know it is oversold based on the RSI, but that doesn’t always mean something because it can become more oversold. Besides, the pattern suggests the RSI will make a lower low, which means $3,020 is probably on the way.

Roku (ROKU)
Roku is getting close to going over the cliff at $287. It isn’t that I don’t like the product; I think the stock is overvalued and not appropriately priced given what the product is. Anyway, after $287 comes $228, and after that, $151. That could be the most perfect double-top pattern I have ever seen.

–
Originally Posted on October 4, 2021 – Stocks Fall Sharply On October 4 As Fundamental Shifts Begin To Take Shape
Disclosure: Mott Capital Management
Mott Capital Management is the portfolio manager for one portfolio offered by Interactive Advisors. Interactive Advisors clients do not invest directly with the Portfolio Managers like Mott Capital Management, and the Managers do not have discretionary trading authority over Interactive Advisors client accounts. The Portfolio Managers on the Interactive Advisors platform simply license their trade data to Interactive Advisors, which then allows its clients to have the same strategy and trading decisions mirrored in their accounts if the Portfolio is in line with their risk score. Portfolio Managers like Mott Capital Management implement their trading philosophy and strategy without knowing the identity of Interactive Advisors’ clients or taking into account these clients’ individualized circumstances.
Mott Capital Management has entered into a Portfolio Manager License Agreement with Interactive Advisors pursuant to which it provides trading data IA uses to offer a portfolio to its investment advisory clients. Mott Capital Management is not affiliated with any entities in the Interactive Brokers Group.
Interactive Advisors is an affiliate of Interactive Brokers LLC.
Pursuant to the Investment Management Agreement between Interactive Advisors and its clients, all brokerage transactions occur through Interactive Brokers LLC, an affiliate of Interactive Advisors. The use of an affiliate for brokerage services represents a potential conflict of interest as Interactive Brokers LLC is paid a commission on trades executed on behalf of Interactive Advisors. Interactive Brokers LLC does not consider this conflict material as it does not sell, solicit, recommend, trade against or otherwise attempt to induce Interactive Advisors to place any orders in any products. Interactive Advisors does not offer services through any other broker-dealer. All trading by Interactive Advisors is self-directed. Interactive Advisors clients acknowledge this potential conflict of interest and authorize Interactive Advisors to execute transactions through Interactive Brokers LLC when they open an Interactive Advisors account. Clients should consider the commissions and other expenses, execution, clearance, and settlement capabilities of Interactive Brokers LLC as a factor in their decision to invest in an Interactive Advisors Portfolio. Interactive Advisors believes it satisfies its best execution obligation by trading its clients’ trades through Interactive Brokers LLC. While there can be no assurance that it will in fact achieve best execution, Interactive Advisors does periodically monitor the execution quality of transactions to ensure that clients receive the best overall trade execution pursuant to regulatory requirements.
Disclosure: Interactive Brokers
Information posted on IBKR Campus that is provided by third-parties does NOT constitute a recommendation that you should contract for the services of that third party. Third-party participants who contribute to IBKR Campus are independent of Interactive Brokers and Interactive Brokers does not make any representations or warranties concerning the services offered, their past or future performance, or the accuracy of the information provided by the third party. Past performance is no guarantee of future results.
This material is from Mott Capital Management and is being posted with its permission. The views expressed in this material are solely those of the author and/or Mott Capital Management and Interactive Brokers is not endorsing or recommending any investment or trading discussed in the material. This material is not and should not be construed as an offer to buy or sell any security. It should not be construed as research or investment advice or a recommendation to buy, sell or hold any security or commodity. This material does not and is not intended to take into account the particular financial conditions, investment objectives or requirements of individual customers. Before acting on this material, you should consider whether it is suitable for your particular circumstances and, as necessary, seek professional advice.


