


Markets typically gravitate towards round numbers. I’m not sure exactly why, but I suspect the reason is buried somewhere in our psyches. They’re easy to understand and make simple milestones. That is why I was somewhat perplexed about how the 3,900 level of the S&P 500 Index (SPX) is proving to be a more critical level of support than the more obvious 4,000 level.
The 3,900 level came into play last week and earlier this week, when declines found support in that region. Last week’s selloffs and failed rally stopped at the 3,905 level more than once, and while we pierced the 3,900 a couple of times yesterday, it held and provided the basis for this morning’s bounce:
SPX, 5 Days, 5 Minute Bars
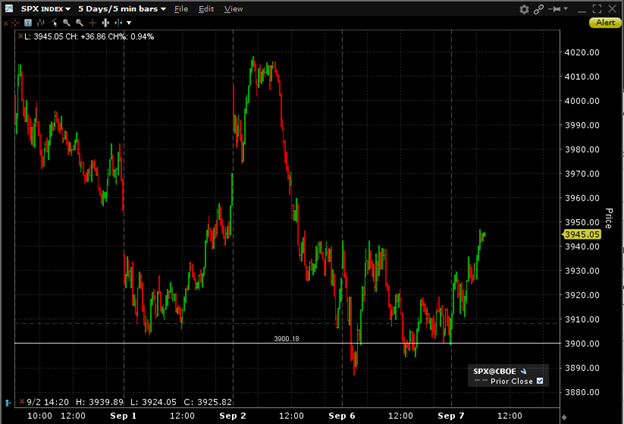
Source: Interactive Brokers
That raises the question – why find support there? Technical analysis asserts that support becomes resistance – and vice versa – and just a few months ago the 3,900 level provided both. A longer-term chart shows that 3,900 provided support for a failed bounce in late May, and then resistance in late June and early July before the powerful late summer (bear market?) rally that ensued:
SPX, 7 Months, Daily Bars
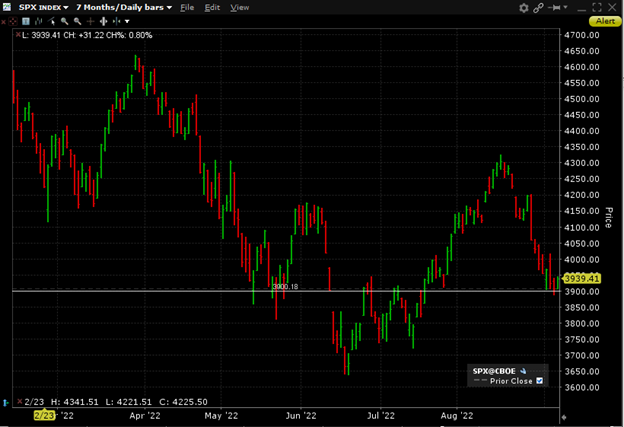
Source: Interactive Brokers
Still, that chart fails to show why 3,900 provided support earlier this year. For that, we need to look even further back to early 2021:
SPX, 2 Years, Daily Bars
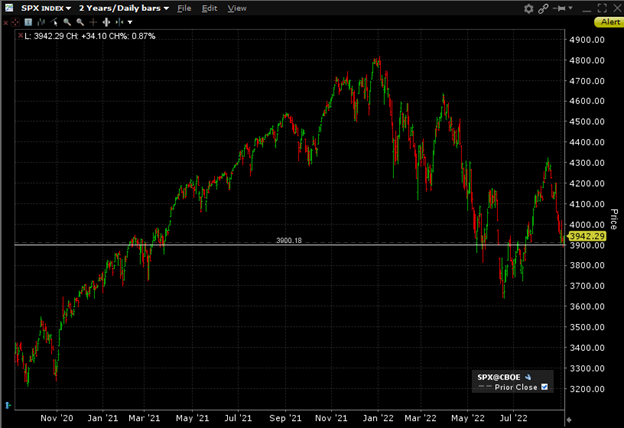
Source: Interactive Brokers
Notice that SPX stalled around the 3,900 during its inexorable advance from late-2020 to the start of this year. I’ve never been mountaineering, so I apologize in advance if this analogy is inapt, but we can think of 3,900 as the final base camp before investors began their assault on the 4,000 level and beyond. We can see from the chart above that the seemingly more significant 4,000 level provided no resistance on the way up, and thus no support on the way down, while 3,900 did both.
Just before the first attempt at SPX 4,000, we wrote about the market’s fascination with round numbers in a piece entitled “Markets Love Round Numbers – 50k, 30k, 4k, 20, 1.25” The numbers that drew our attention in February 2021 now seem mostly incongruous, with 4,000 proving to be the lone exception. The 50k level referred to bitcoin, which is firmly below $20,000 today. The Nikkei 225 indeed reached the 30,000 mark, but never made it as far as 31,000 despite a few attempts. It now trades over 8% lower even as the yen plunges. We were using 20 as a benchmark for the Cboe Volatililty Index (VIX). It rose sharply during the initial meme stock frenzy a few weeks prior to when the column was published. The 20 level acted as the lower bound for VIX’s trading range for another month or so, then became the high end of a 15-20 range that persisted for months. We did see VIX touch 20 about 3 weeks ago, but we have spent most of the past few sessions above 25. Finally, fretting about a 1.25% 10-Year Treasury yield seems laughable with rates above 3.25% today.
The message from the markets this week has been to avoid focusing on the big round numbers, like 4,000 for SPX, and instead on numbers that have proven meaningful in the recent past, like 3,900. They will offer better guideposts for your trading.
Disclosure: Interactive Brokers
The analysis in this material is provided for information only and is not and should not be construed as an offer to sell or the solicitation of an offer to buy any security. To the extent that this material discusses general market activity, industry or sector trends or other broad-based economic or political conditions, it should not be construed as research or investment advice. To the extent that it includes references to specific securities, commodities, currencies, or other instruments, those references do not constitute a recommendation by IBKR to buy, sell or hold such investments. This material does not and is not intended to take into account the particular financial conditions, investment objectives or requirements of individual customers. Before acting on this material, you should consider whether it is suitable for your particular circumstances and, as necessary, seek professional advice.
The views and opinions expressed herein are those of the author and do not necessarily reflect the views of Interactive Brokers, its affiliates, or its employees.


