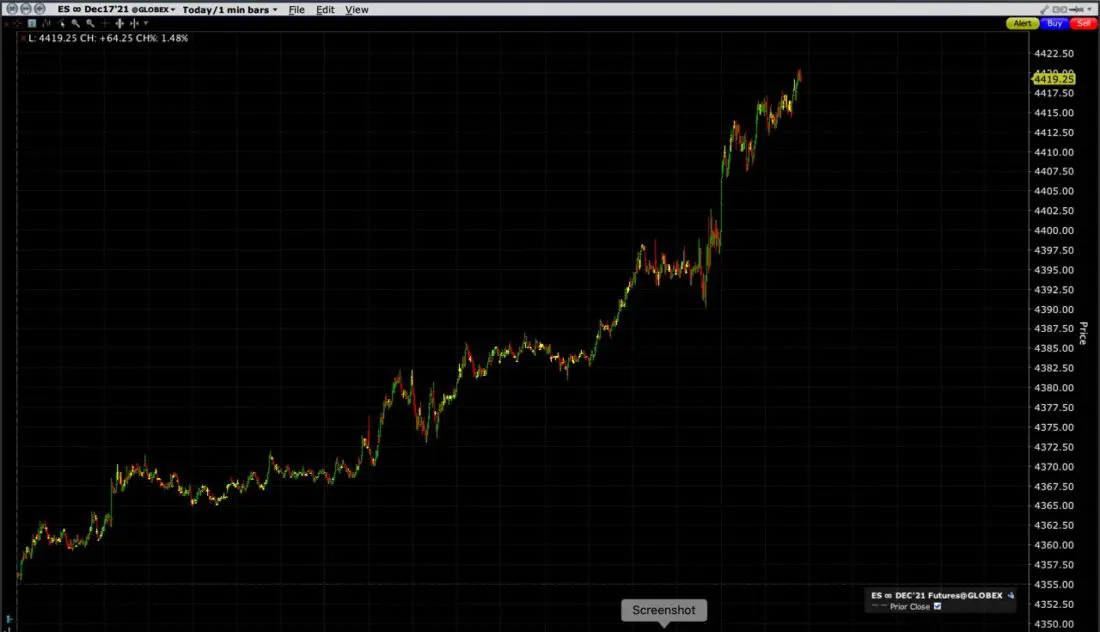
This morning we are seeing a nice bounce in major US equity indices, with most of them about 1.5% higher. There were certainly valid reasons for today’s enthusiasm. We received solid earnings from major banks, a PPI report that beat expectations, and jobless claims at pandemic-era lows. Although we warned yesterday about the dangers of blindly following a suspicious pre-market bounce in index futures, there was nothing suspicious about today’s pre-market trading. Futures rose steadily overnight, and the bumps higher were clearly in reaction to rising world markets and the upbeat news:
SPX E-mini Futures (ES), Intraday Trading Including Pre-Market

Source: Interactive Brokers
The big jumps were at 7:00 AM (EDT), when bank earnings began to flow, at 8:30, when the economic reports were released, and 10:10 as we broke through the 4400 level (more about that later). It is important to distinguish investment activity from speculative events. So far, today is the former.
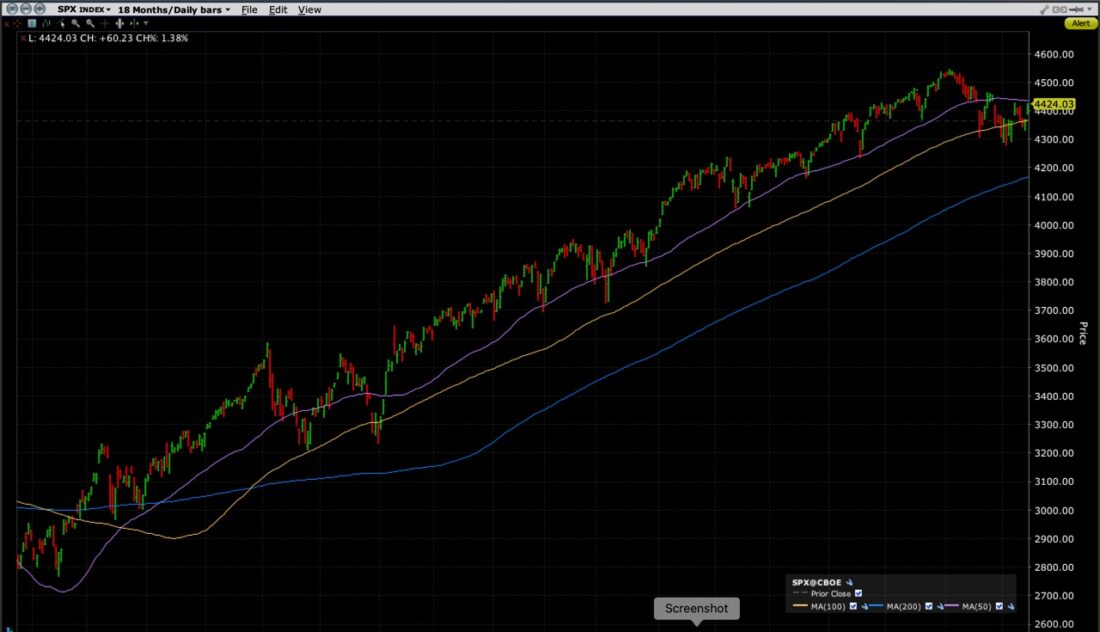
Yet the action in the S&P 500 Index (SPX) has been very well-behaved, at least so far today. Consider the graph below, paying special attention to the purple line near the top, which is the 50-day moving average:
SPX Daily Graph, 18 Months (bars) with 50-Day (purple), 100-Day (yellow), and 200-Day Moving Averages


Source: Interactive Brokers
It is amazing how well-behaved SPX has been over the past 18 months. Since the post-Covid rebound began in earnest, moving averages have defined the uptrend almost perfectly. The 50-day moving average has been supportive throughout, failing to support the advance only 3 times prior to now, and even then, only briefly. This is the longest period that SPX has remained below that average in about 1.5 years.
It should not be at all surprising that today’s advance is pausing at the 50-day moving average. Technical analysis posits that support becomes resistance. If the index has been so respectful of that prior support, it is logical to expect that it would utilize that same average’s level as short-term resistance.
The bigger question for investors is whether we should be expecting to see the 50-day average resuming its focus as a source of support or resistance. Until yesterday, we had seen a short-term patter of lower highs and lower lows. That is rarely a positive sign. Yesterday we flirted with another dip, but never tested last week’s lows. Instead, we bounced into the close, with the advance stopping at the 100-day moving average that has recently superseded the 50-day average as the primary trend for SPX.
Yet after all this consideration of technical analysis – support, resistance, moving averages, and the like – it has a way of failing at the most inopportune times. Just because we are taking an intra-day breather at the 50-day moving average means nothing going forward. Quite specifically, we have a monthly options expiration tomorrow. Index options expire on the open, with stocks and ETFs expiring at the close. The open interest on the expiring SPX 4450 line is nearly 50,000 contracts, which dwarfs all the other lines around it. The nearest is 4400 with just over 30,000 contracts, and I think it is no coincidence that SPX shot higher when we broke through that level this morning. Large options positions can act like magnets or slingshots when stocks or indices approach them just before expiration. When a strike is approached or crossed, someone needs to re-hedge. The larger the open interest, the larger the need to re-hedge. Well behaved or not, it would not shock me if we tested the 4450 level either this afternoon or on tomorrow’s open.
Disclosure: Interactive Brokers
The analysis in this material is provided for information only and is not and should not be construed as an offer to sell or the solicitation of an offer to buy any security. To the extent that this material discusses general market activity, industry or sector trends or other broad-based economic or political conditions, it should not be construed as research or investment advice. To the extent that it includes references to specific securities, commodities, currencies, or other instruments, those references do not constitute a recommendation by IBKR to buy, sell or hold such investments. This material does not and is not intended to take into account the particular financial conditions, investment objectives or requirements of individual customers. Before acting on this material, you should consider whether it is suitable for your particular circumstances and, as necessary, seek professional advice.
The views and opinions expressed herein are those of the author and do not necessarily reflect the views of Interactive Brokers, its affiliates, or its employees.
Disclosure: Options Trading
Options involve risk and are not suitable for all investors. Multiple leg strategies, including spreads, will incur multiple commission charges. For more information read the "Characteristics and Risks of Standardized Options" also known as the options disclosure document (ODD) or visit ibkr.com/occ
Disclosure: Futures Trading
Futures are not suitable for all investors. The amount you may lose may be greater than your initial investment. Before trading futures, please read the CFTC Risk Disclosure. A copy and additional information are available at ibkr.com.


