A little under two years ago, the S&P 500 Index (SPX) made a momentous addition. After months of speculation, the index added Tesla (TSLA) to its ranks on December 21, 2020. TSLA is now the 4th highest weighted stock in SPX[i]. This is a remarkable achievement for a company that came public just over 12 years ago.
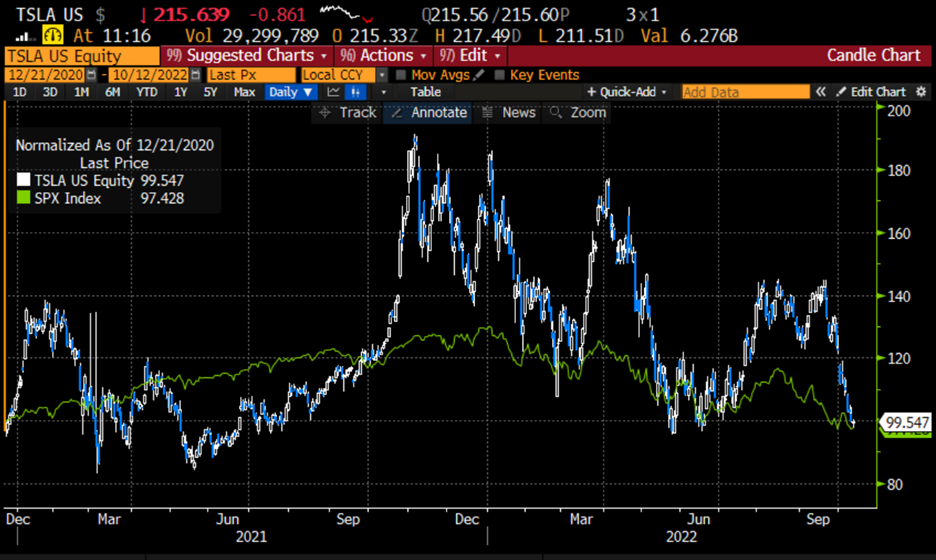
Question – Since its addition to the index, by how much is TSLA outperforming SPX?
Answer – About 2%. And with much more volatility. See the graph below:
TSLA (blue/white daily bars) vs. SPX (green line), Normalized to December 21st, 2020

Source: Bloomberg
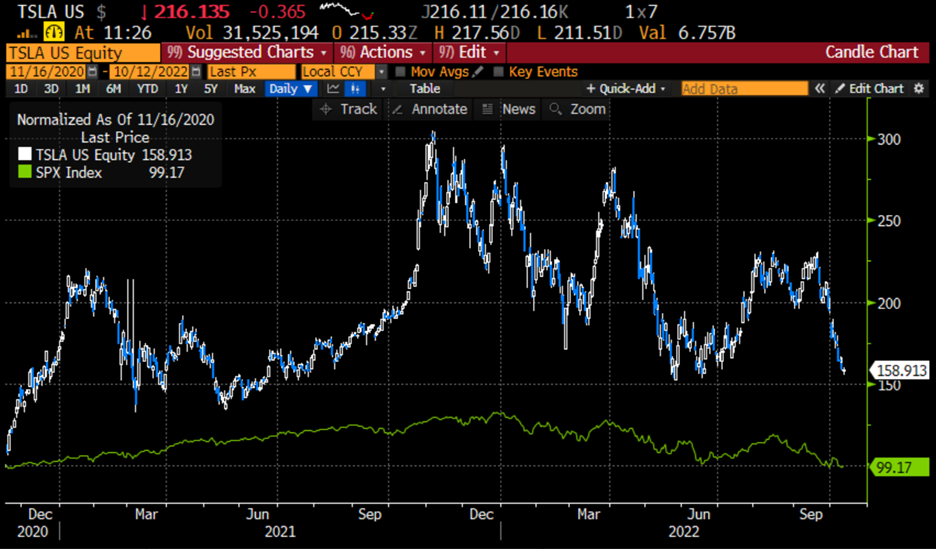
Some might accuse me of cherry-picking the data after TSLA has suffered a dramatic plunge. That’s fair, but it’s not as though SPX has been ripping higher lately. It’s also important to acknowledge that TSLA had a spectacular run-up in the period leading up to its index addition. The index announcement was made on November 16th, 2020 after the markets closed. TSLA’s outperformance since then has been spectacular:
TSLA (blue/white daily bars) vs. SPX (green line), Normalized to December 21st, 2020


Source: Bloomberg
Those investors who owned TSLA in hopes that it would be added to SPX were lavishly rewarded for their faith in the days leading up to and after the index addition. Unfortunately, very little of that benefit has accrued over time to the passive index investors who received exposure to TSLA once it joined the index.
History is nice, but investing is about the future and those who invest in TSLA are firm believers in the future. If they weren’t, they wouldn’t be willing to pay 75x trailing 12-month earnings and about 50x next year’s. The latter statistic implies a PEG ratio[ii] over 5.5x based on the prevailing consensus earnings. That is an aggressive growth premium by any standard.
The TSLA faithful will rightfully tell you about how there have always been skeptics pointing out the stock’s perpetually high, seemingly excessive, valuations, and that over the long run the skeptics have been proven wrong. That is quite fair. But as noted before, investing is about the future. Those who are paying 50x next year’s earnings are implicitly saying that TSLA’s earnings will grow much faster than published consensus. If you’re investing on that basis, with a valid rationale for that belief, it’s not my job to dissuade you.
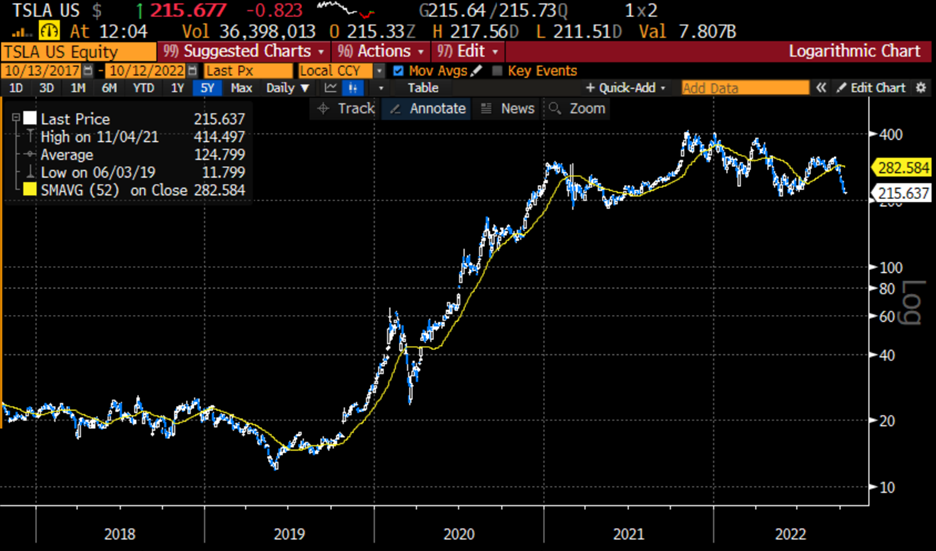
But if you’re buying simply because the stock has fallen about 50% from its highs, then I would like to offer some caution. Looking at the charts above, one could hardly be blamed for noting that TSLA is trading at levels that provided support over the past year and a half. But when we look at a longer-term chart, one could get a sense of vertigo:
TSLA Logarithmic Chart – 5 Years Daily Data with 52 day Moving Average


Source: Bloomberg
A logarithmic scale is the only way to make sense of TSLA’s long-term performance. Even then, it looks like the trajectory of a SpaceX rocket launch. The problem with such a view, however, is that it reveals that the current drawdown is merely a blip in TSLA’s longer-term performance. A further 50% decline would still only put a minor dent in the stock’s remarkable returns. A longer historical view shows that even amidst a series of sharp rises and subsequent plateaus, we have seen various pullbacks of larger magnitudes. The following chart is a logarithmic view of TSLA since it went public:
TSLA Logarithmic Chart – Weekly Data since IPO with 52-Week Moving Average


Source: Bloomberg
Throughout its history, TSLA has seen some dramatic pullbacks even as it has risen spectacularly. We think of its rise as inexorable, but it has actually been the result of a few sharp jumps ahead of long plateaus. Even if you think that we’re in another plateauing period, are you convinced that we are at the low end of the latest plateau? If you’re buying, you ought to be.
Also, while TSLA has performed well during previous broad market selloffs, it has only been public during a period of monetary expansion and generally rising equity markets. The track record of stocks with premium valuations during prolonged bear markets is not good. If you fear a lackluster market, high P/E stocks are not usually the best way to play them.
TSLA has consistently proven its skeptics wrong and rewarded its acolytes. It is difficult to be negative about a company that is a market leader in a burgeoning business. But great companies do not always make great stocks all the time. If you’re buying the stock at current levels, please keep that in mind.
—
[i] The two classes of Alphabet stock, GOOG and GOOGL, are 5th and 6th, but their combined weight makes Alphabet the 3rd largest company and TSLA is the 5th largest by that measure.
[ii] PEG -> Price/Earnings/Growth. The P/E ratio divided by earnings growth. For reference, Apple (AAPL) has a PEG of 2.25, while Exxon’s (XOM) is 0.35
Disclosure: Interactive Brokers
The analysis in this material is provided for information only and is not and should not be construed as an offer to sell or the solicitation of an offer to buy any security. To the extent that this material discusses general market activity, industry or sector trends or other broad-based economic or political conditions, it should not be construed as research or investment advice. To the extent that it includes references to specific securities, commodities, currencies, or other instruments, those references do not constitute a recommendation by IBKR to buy, sell or hold such investments. This material does not and is not intended to take into account the particular financial conditions, investment objectives or requirements of individual customers. Before acting on this material, you should consider whether it is suitable for your particular circumstances and, as necessary, seek professional advice.
The views and opinions expressed herein are those of the author and do not necessarily reflect the views of Interactive Brokers, its affiliates, or its employees.


