Unveiling TSLA’s Implied Volatility Skew: A Bullish Signal Among S&P 500 Stocks
Implied volatility skew, particularly in the context of TSLA (Tesla, Inc.), provides valuable insights into market sentiment and expectations. Currently, TSLA exhibits the most bullish implied volatility skew among all S&P 500 stocks. By analyzing the 1-month Risk Reversal Benchmark and examining the distribution of open interest in TSLA options, we can gain a deeper understanding of this trend. Additionally, the comparison to other stocks, such as MSFT, reveals interesting differences in skew patterns. Although it is impossible to know future outcomes, traders seem to be positioning themselves for a potentially significant upside move in TSLA.
Exploring the Implied Volatility Skew:

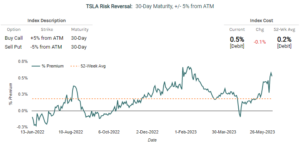
Source: Marketchameleon TSLA 1 Month Risk Reversal Benchmark
The current implied volatility skew in TSLA is not only bullish but also inverted to the upside. This means that the out-of-the-money call options are trading at a higher cost compared to the out-of-the-money put options. Specifically, the 1-month Risk Reversal Index for TSLA indicates that buying a 5% out-of-the-money call option (above the spot price) and simultaneously selling a 5% out-of-the-money put option (below the spot price) would result in a debit of 0.5% relative to the stock price.
The premium of 0.5% signifies that traders are willing to pay a higher price for the potential gains associated with the upside movement in TSLA’s stock price. This cost is higher than the 52-week average of 0.2%, further indicating increased demand and a preference for upside wing options.
The inverted implied volatility skew, with higher prices for out-of-the-money calls compared to puts, suggests a bullish sentiment and an expectation of potential upward price movements in TSLA. Traders and investors are showing a greater interest in acquiring call options, which provide the right to buy the stock at a predetermined price, indicating optimism regarding TSLA’s future prospects.
This higher demand for upside wing options, as reflected in the elevated cost of out-of-the-money calls relative to puts, supports the idea that market participants anticipate a significant move to the upside in TSLA’s stock price.
Comparing TSLA to MSFT:
When comparing TSLA’s implied volatility skew to that of MSFT (Microsoft Corporation), an interesting observation emerges. While TSLA’s skew is bullish, MSFT exhibits a flat skew. In MSFT’s case, the price of the out-of-the-money call and put options are at the same premium relative to the spot price. This disparity suggests different market expectations and sentiment for the two stocks.
TSLA’s Open Interest and Options Distribution:


Source: Marketchameleon TSLA Open Interest
An intriguing aspect of TSLA’s options market is the significant open interest in the 19-Jan-25 expiration date. Analyzing the distribution of open interest for this period, we find that approximately 63% of the open interest lies in call options. Furthermore, strikes above the 280 level consist almost entirely of call options. Among these, the highest open interest is observed at the 825 strike, with the stock currently trading at $247. Notably, for TSLA to reach this strike, it would require a remarkable increase of over 330%, with 259 trading days remaining until expiration. The fact that this out-of-the-money call option, currently bid at $1.10 with consistent trading volume, was trading at around $0.20 cents just a month ago is indicative of increased market interest and potential bullish sentiment.
Implied Volatility Trends:
While TSLA’s implied volatility is currently low, it has been trending above its 20-day moving average. In contrast, the broader market volatility has been trending below its moving average. This discrepancy suggests that market participants perceive TSLA to have a greater potential for a significant move compared to the overall market.
TSLA’s Implied Volatility Skew Points to Upside Potential and Market Optimism
Analyzing TSLA’s implied volatility skew and related factors provides valuable insights into the market sentiment and expectations for the stock. The bullish skew, as indicated by the Risk Reversal Index, coupled with the distribution of open interest in call options, suggests a prevailing sentiment favoring an upward price movement in TSLA. While the future remains uncertain, traders seem to be positioning themselves for a potentially significant upside move.
—
Originally Posted June 12, 2023 – TSLA Implied Volatility Skew Signals Bullish Sentiment Amidst S&P 500 Stocks
Disclosure: Market Chameleon
The information provided on MarketChameleon is for educational and informational purposes only. It should not be considered as financial or investment advice. Trading and investing in financial markets involve risks, and individuals should carefully consider their own financial situation and consult with a professional advisor before making any investment decisions. MarketChameleon does not guarantee the accuracy, completeness, or reliability of the information provided, and users acknowledge that any reliance on such information is at their own risk. MarketChameleon is not responsible for any losses or damages resulting from the use of the platform or the information provided therein. The 7-day free trial is offered for evaluation purposes only, and users are under no obligation to continue using the service after the trial period.
Disclosure: Interactive Brokers
Information posted on IBKR Campus that is provided by third-parties does NOT constitute a recommendation that you should contract for the services of that third party. Third-party participants who contribute to IBKR Campus are independent of Interactive Brokers and Interactive Brokers does not make any representations or warranties concerning the services offered, their past or future performance, or the accuracy of the information provided by the third party. Past performance is no guarantee of future results.
This material is from Market Chameleon and is being posted with its permission. The views expressed in this material are solely those of the author and/or Market Chameleon and Interactive Brokers is not endorsing or recommending any investment or trading discussed in the material. This material is not and should not be construed as an offer to buy or sell any security. It should not be construed as research or investment advice or a recommendation to buy, sell or hold any security or commodity. This material does not and is not intended to take into account the particular financial conditions, investment objectives or requirements of individual customers. Before acting on this material, you should consider whether it is suitable for your particular circumstances and, as necessary, seek professional advice.
Disclosure: Options Trading
Options involve risk and are not suitable for all investors. Multiple leg strategies, including spreads, will incur multiple commission charges. For more information read the "Characteristics and Risks of Standardized Options" also known as the options disclosure document (ODD) or visit ibkr.com/occ


Join The Conversation
If you have a general question, it may already be covered in our FAQs. If you have an account-specific question or concern, please reach out to Client Services.