


As Tesla (TSLA) prepares to announce its earnings on July 19 after the market closes, investors and traders eagerly anticipate the impact of this information on the stock’s price. One valuable tool for evaluating market sentiment is historical statistics, which provide insights into past stock behavior during earnings events. By comparing the current market’s implied moves with historical data, we can assess whether the market’s estimate is higher or lower than usual. In this blog post, we will examine the implications of the current straddle, potential risks and profits, and how to evaluate opportunities based on various outlooks on TSLA’s earnings moves.
Current Market Implied Move vs Historical
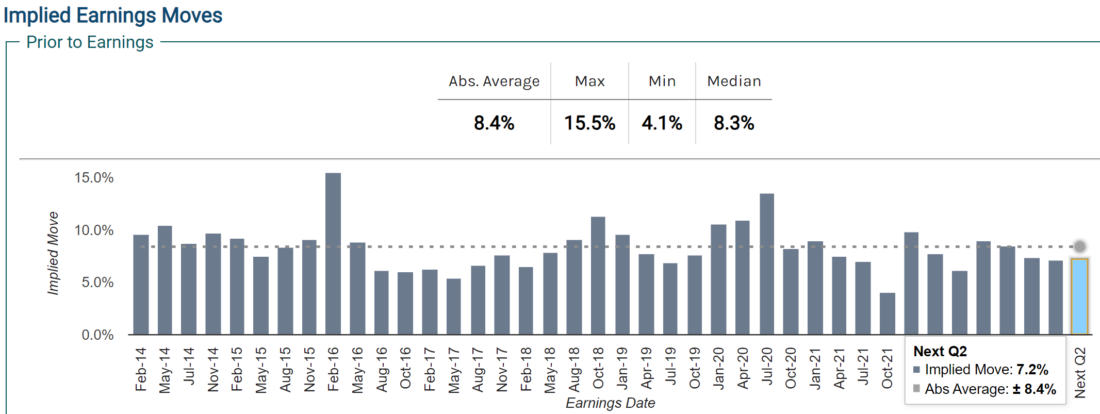
The straddle, a strategy involving the purchase of both a call and a put option with the same strike price and expiration date, suggests that TSLA may experience a move of +/- 7.2% following its earnings announcement. To gauge the significance of this implied move, we turn to historical observations. On average, the options implied a move of 8.4%, indicating that the current market is pricing in a lower move compared to historical averages. Furthermore, when focusing solely on second quarter earnings (Q2), the implied move averaged around 8%. Consequently, the current straddle appears to be priced below its historical average.
Comparison with Actual Earnings Moves
TSLA Historial Earnings Price Movement Statistics
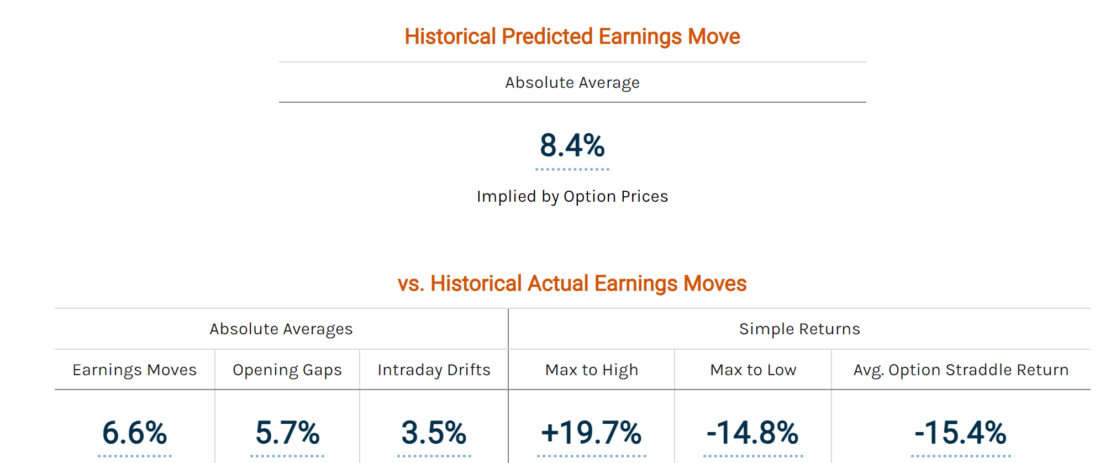
To validate the market’s expectations, it is crucial to compare implied moves with actual historical data. On average, TSLA moved +/- 6.6% following earnings announcements, suggesting that the implied moves tended to overestimate the actual moves. Moreover, at the market open, TSLA exhibited an average move of +/- 5.7%. These findings indicate that the implied moves often overestimated the stock’s post-earnings movement.
Examining Risk and Profit Potential
Considering the average return on the option straddle held over earnings, it becomes evident that the straddle strategy incurred losses, with an average of -15.4%. TSLA also experienced significant intraday volatility, with an average move from the open to the close of +/- 3.5%. The highest upward move observed was 19.7%, while the largest downward move was -14.8%. These extreme price swings highlight the substantial risk involved in selling the straddle, as they exceed the straddle’s potential coverage. Traders must be cautious when utilizing such strategies to manage risk effectively.
Insights from Q2 Data
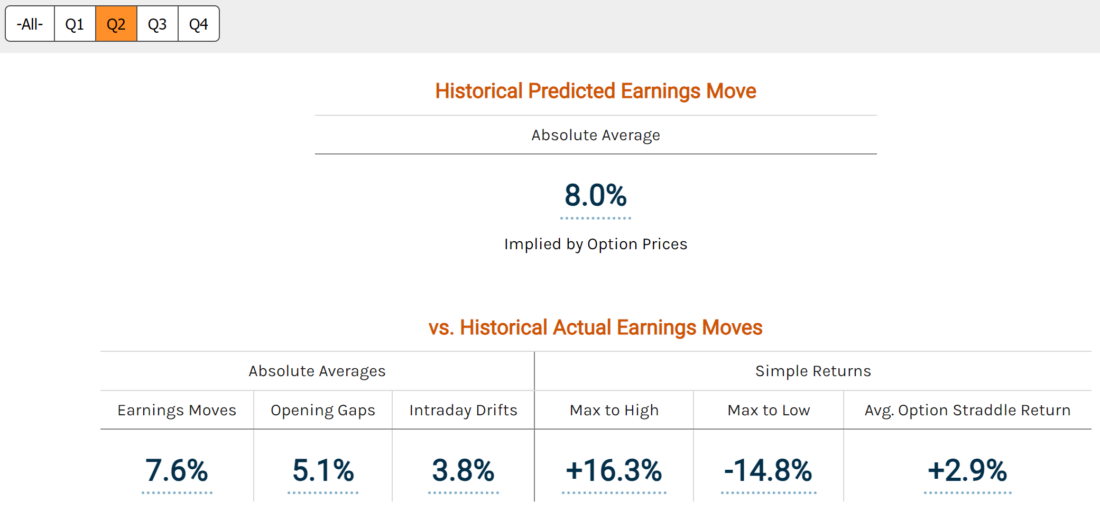
To gain a more focused perspective, we delve into Q2 data exclusively. Here, the average move following earnings was +/- 7.6%, with the straddles recording an average gain of +2.9%. This suggests that the current implied straddle is priced at a level closer to historical averages when considering Q2 data specifically. These insights could be valuable to traders seeking to evaluate potential earnings moves using averages, extreme moves, and tendencies, thus aiding in risk-reward analysis.
Conclusion
While it is important to acknowledge that historical trends do not guarantee future outcomes, leveraging historical statistics can help traders make more informed decisions in the face of high uncertainty and risk. Our analysis of TSLA’s historical stock behavior during earnings events provides insights into market expectations and the potential risks and profits associated with the current straddle pricing. By considering average moves, extreme price swings, and historical tendencies, traders can enhance their risk management strategies and approach earnings events with a more informed outlook.
—
Originally Posted July 19, 2023 – TSLA’s Earnings: Historical Insights and Market Expectations
Disclosure: Market Chameleon
The information provided on MarketChameleon is for educational and informational purposes only. It should not be considered as financial or investment advice. Trading and investing in financial markets involve risks, and individuals should carefully consider their own financial situation and consult with a professional advisor before making any investment decisions. MarketChameleon does not guarantee the accuracy, completeness, or reliability of the information provided, and users acknowledge that any reliance on such information is at their own risk. MarketChameleon is not responsible for any losses or damages resulting from the use of the platform or the information provided therein. The 7-day free trial is offered for evaluation purposes only, and users are under no obligation to continue using the service after the trial period.
Disclosure: Interactive Brokers
Information posted on IBKR Campus that is provided by third-parties does NOT constitute a recommendation that you should contract for the services of that third party. Third-party participants who contribute to IBKR Campus are independent of Interactive Brokers and Interactive Brokers does not make any representations or warranties concerning the services offered, their past or future performance, or the accuracy of the information provided by the third party. Past performance is no guarantee of future results.
This material is from Market Chameleon and is being posted with its permission. The views expressed in this material are solely those of the author and/or Market Chameleon and Interactive Brokers is not endorsing or recommending any investment or trading discussed in the material. This material is not and should not be construed as an offer to buy or sell any security. It should not be construed as research or investment advice or a recommendation to buy, sell or hold any security or commodity. This material does not and is not intended to take into account the particular financial conditions, investment objectives or requirements of individual customers. Before acting on this material, you should consider whether it is suitable for your particular circumstances and, as necessary, seek professional advice.


Join The Conversation
If you have a general question, it may already be covered in our FAQs. If you have an account-specific question or concern, please reach out to Client Services.