


This retailer is positioned well to grow its top and bottom lines over the long term, but the stock is priced as if profits will fall below pre-pandemic levels. Dollar General (DG: $206/share as of time of publication) is this week’s Long Idea.
DG presents quality risk/reward given Dollar General’s:
- largest brick-and-mortar footprint in the U.S.
- rising market share and same-store sales
- small low-cost store format is difficult for competitors to replicate
- high profitability, especially capital turnover, amongst peers
- strong growth opportunities
Largest Brick-and-Mortar Footprint in the U.S.
With a store within five miles of 75% of the U.S. population, Dollar General offers many millions of consumers convenience and creates strong brand awareness.
At the end of 2020[1], Dollar General operated 17 thousand stores, more than Dollar Trees’ (DLTR) ~15,700 stores, 1.9X the number of Walgreen’s (WBA) stores, and 1.2x the combined store count of Walmart (WMT), Kroger (KR), Target (TGT), Big Lots (BIG), Five Below (FIVE), and Albertson’s (ACI), per Figure 1.
Figure 1: Dollar General’s U.S. Store Count Vs. Competition – 2020
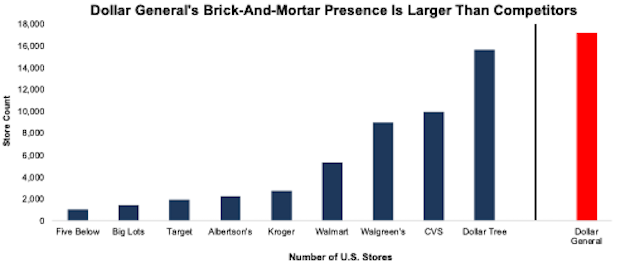
Sources: New Constructs, LLC and company filings.
Brick-and-Mortar Footprint Is Growing and Taking Market Share
Dollar General is aggressively expanding its footprint. Per Figure 2, Dollar General’s share of U.S. retail stores grew even more during the pandemic as many weaker operators closed stores. Dollar General stores comprised 5.2% of all U.S. brick-and-mortar stores in 2020, up from 3.5% in 2018. The firm plans to add an additional 1,050 stores in 2021.
Click here to read the full post
—
This article originally published on October 6, 2021.
Disclosure: David Trainer, Kyle Guske II, Alex Sword, and Matt Shuler receive no compensation to write about any specific stock, style, or theme.
Follow us on Twitter, Facebook, LinkedIn, and StockTwits for real-time alerts on all our research.
[1] Dollar General’s last fiscal year ended January 29, 2021, which we refer to throughout the report as 2020.
[2] Five Below’s TTM ROIC is up from 9% in 2020 and may not be sustainable going forward. Five Below’s 2-year average ROIC of 12% is well below Dollar General’s 2-year ROIC of 14%.
[3] Only Core Earnings enable investors to overcome the inaccuracies, omissions and biases in legacy fundamental data and research, as proven in Core Earnings: New Data & Evidence, written by professors at Harvard Business School (HBS) & MIT Sloan and published in The Journal of Financial Economics.
Click here to download a PDF of this report.
Disclosure: New Constructs
David Trainer, Kyle Guske II, Sam McBride, Matt Shuler, Alex Sword, and Andrew Gallagher receive no compensation to write about any specific stock, style, or theme.
The information and opinions presented in this report are provided to you for information purposes only and are not to be used or considered as an offer or solicitation of an offer to buy or sell securities or other financial instruments. New Constructs has not taken any steps to ensure that the securities referred to in this report are suitable for any particular investor and nothing in this report constitutes investment, legal, accounting or tax advice. This report includes general information that does not take into account your individual circumstance, financial situation or needs, nor does it represent a personal recommendation to you. The investments or services contained or referred to in this report may not be suitable for you and it is recommended that you consult an independent investment advisor if you are in doubt about any such investments or investment services.
Information and opinions presented in this report have been obtained or derived from sources believed by New Constructs to be reliable, but New Constructs makes no representation as to their accuracy, authority, usefulness, reliability, timeliness or completeness. New Constructs accepts no liability for loss arising from the use of the information presented in this report, and New Constructs makes no warranty as to results that may be obtained from the information presented in this report. Past performance should not be taken as an indication or guarantee of future performance, and no representation or warranty, express or implied, is made regarding future performance. Information and opinions contained in this report reflect a judgment at its original date of publication by New Constructs and are subject to change without notice. New Constructs may have issued, and may in the future issue, other reports that are inconsistent with, and reach different conclusions from, the information presented in this report. Those reports reflect the different assumptions, views and analytical methods of the analysts who prepared them and New Constructs is under no obligation to insure that such other reports are brought to the attention of any recipient of this report.
New Constructs’ reports are intended for distribution to its professional and institutional investor customers. Recipients who are not professionals or institutional investor customers of New Constructs should seek the advice of their independent financial advisor prior to making any investment decision or for any necessary explanation of its contents.
In-depth risk/reward analysis underpins our stock rating. Our stock rating methodology grades every stock according to what we believe are the 5 most important criteria for assessing the quality of a stock. Each grade reflects the balance of potential risk and reward of buying that stock. Our analysis results in the 5 ratings described below. Very Attractive and Attractive correspond to a “Buy” rating, Very Unattractive and Unattractive correspond to a “Sell” rating, while Neutral corresponds to a “Hold” rating.
Disclosure: Interactive Brokers
Information posted on IBKR Campus that is provided by third-parties does NOT constitute a recommendation that you should contract for the services of that third party. Third-party participants who contribute to IBKR Campus are independent of Interactive Brokers and Interactive Brokers does not make any representations or warranties concerning the services offered, their past or future performance, or the accuracy of the information provided by the third party. Past performance is no guarantee of future results.
This material is from New Constructs and is being posted with its permission. The views expressed in this material are solely those of the author and/or New Constructs and Interactive Brokers is not endorsing or recommending any investment or trading discussed in the material. This material is not and should not be construed as an offer to buy or sell any security. It should not be construed as research or investment advice or a recommendation to buy, sell or hold any security or commodity. This material does not and is not intended to take into account the particular financial conditions, investment objectives or requirements of individual customers. Before acting on this material, you should consider whether it is suitable for your particular circumstances and, as necessary, seek professional advice.


