Looking at equity markets as a conflict between Value stocks and Growth stocks has become a reflex for many market commentators. ‘Growth is beating Value’ (or the other way around) is always a good headline. Value stocks are defined as basically cheap stocks and it is, therefore, possible in any index, to point to the Value side of that index. Growth stocks are defined as stocks with above-average growth prospects. So again, it is possible to look at an index and point to the growthiest stocks. The main index providers have done exactly that by splitting their main indices in two down the middle, a Growth and a Value version, as early as the 1980s.
Using Value and Growth to explain the last ten years
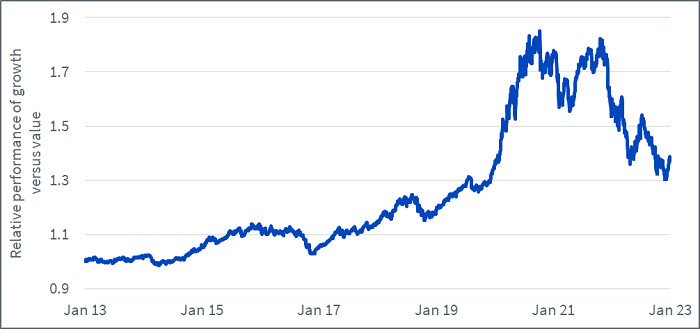
While simplistic and playing into human’s love of false dichotomies, it is true that this narrative explained the last ten years of equity performance pretty well. From the overwhelming domination of Growth stocks, in a negative interest rate environment where investment was cheap, to the start of a Value revival last year, on the back of the most aggressive tightening cycle in decades.
Figure 1: Relative performance of Growth vs Value in the last ten years

Source: WisdomTree, Bloomberg. From 31 January 2013 to 31 January 2023. Growth is proxied by the MSCI World Growth net TR Index. Value is proxied by the MSCI World Value net TR Index.
You cannot invest directly in an index.
Historical performance is not an indication of future performance and any investment may go down in value.
What about the other factors? Didn’t Quality perform better over that period?
However, most things in our world can’t be reduced to a simple choice. Academics have demonstrated over the last five decades that multiple other factors can be used to slice and dice the markets to create outperforming portfolios. In the 90s, Fama and French introduced their 3-factors model using Value but also Size and Momentum to explain market returns. More recently, they added Profitability (often called Quality) and Investment in a new 5-factors model.
Looking at the performance of the seven leading factors over the last ten years, we note that while Growth beat the market by 1.6% per annum and Value underperformed by 1.9% per annum, the strongest factor was, in fact, Quality with an outperformance of 2.3% per annum1.
Is Quality Value or Growth, then?
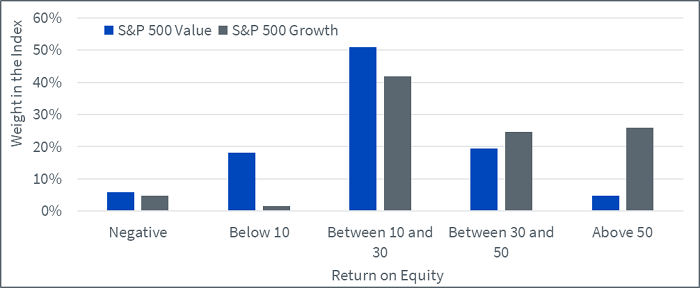
Using Quality as a third lens, we observe that companies in the Value index are, on average, less profitable than those in the benchmark, and that those in the Growth index are, on average, more so. 23% of the S&P 500 Value exhibit less than 10% in return on equity (ROE) versus less than 5% for the S&P 500 Growth. And 25% of the S&P 500 Growth has more than 50% in ROE versus less than 5% for the Value index.
Figure 2: S&P Value and S&P Growth holdings split by return on equity


Source: WisdomTree, Bloomberg. 31 January 2023. Return on equity reflects the consensus estimate for return on equity (that is, the mean of sell-side analyst estimates).
You cannot invest directly in an index.
Historical performance is not an indication of future performance and any investment may go down in value.
However, what is fascinating is that in the Value index, there are still some very profitable companies and in the Growth index, there are still some unprofitable companies. In other words, the Value/Growth dichotomy is very different from the High Quality/Low Quality one. The market could therefore be split not into two indices (Value and Growth) but into four:
- High-Quality Value
- High-Quality Growth
- Low-Quality Value
- Low-Quality Growth
Historically, High-Quality Value has outperformed High-Quality Growth
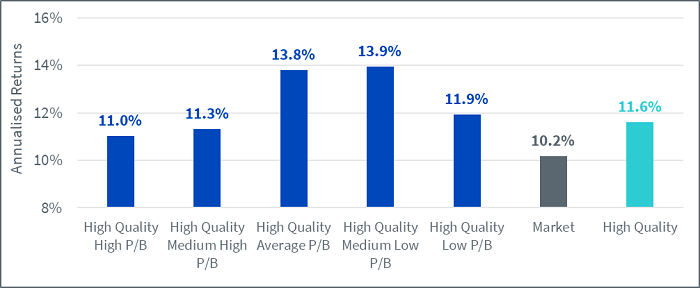
Using academic data, it is possible to splice US equity markets since the 60s into groups by fundamental data. In Figure 3, we focus every year on the 20% of the universe with the highest operating profitability (that is, High Quality in Figure 3). That group is then split into five further quintiles depending on their valuations (using price to book (P/B) as a metric) from the cheapest to the most expensive.
In Figure 3, we observe that picking profitable companies with high P/B would have outperformed the market since the 60s but would have underperformed profitable companies in general. On the contrary, picking cheaper High-Quality companies would have outperformed both the market and the overall High-Quality grouping. In other words, Quality Value has outperformed Quality Growth over the last 60 years in US equity markets. Looking at other geographies, such as Europe, we find similar results.
Figure 3: Annualised returns of High-Quality portfolios of US stocks based on their valuations since the 1960s


Source: Kenneth French data library. Data is calculated at a monthly frequency and from July 1963 to December 2022. ‘High Quality’ representing the top 20% by operating profitability. The portfolios are rebalanced yearly at the end of June. The market represents the portfolio of all available publicly listed stocks in the US. All returns are in USD. Operating profitability for year t is annual revenues minus cost of goods sold, interest expense, and selling, general, and administrative expenses divided by book equity for the last fiscal year end in t-1.
You cannot invest in an index.
Historical performance is not an indication of future performance and any investments may go down in value.
At WisdomTree, we believe that a well-constructed Quality strategy can be the cornerstone of an equity portfolio (see Looking back at equity factors in Q4 with WisdomTree and When inflation is high investors focus on high pricing power equities). High-Quality companies exhibit an ‘all-weather’ behaviour that offers a balance between building wealth over the long term whilst protecting the portfolio during economic downturns. However, in 2022, secondary tilts were incredibly important. Value stocks benefitted from central banks’ hawkishness, leaning on their low implied duration to deliver outstanding performance in a particularly hard year for equities. Among Quality-focused strategies, the one with Value tilt delivered outperformance on average, and the one with Growth tilt tended to underperform.
Looking forward to 2023, recession risk continues to hang over the market like the sword of Damocles. While inflation has shown signs of easing, we expect central banks to remain hawkish around the globe as inflation is still very meaningfully above targets. The recent coordinated communication plan by Federal Reserve Federal Open Market Committee members is a further example of this continued hawkishness. With markets facing many of the same issues in 2023 that they faced in the second half of 2022, it looks like resilient investments that tilt to Quality and Value that have done particularly well in 2022 could continue to benefit.
Sources
1 Source: WisdomTree, Bloomberg. From 31 January 2013 to 31 January 2023. Growth is proxied by the MSCI World Growth net TR Index. Value is proxied by the MSCI World Value net TR Index. Quality is proxied by MSCI World Quality net TR Index. The remaining 4 factors (Min Vol, High Dividend Small Cap and Momentum) are also proxied by indices in the MSCI families.
—
Originally Posted February 16, 2023 – Value, Growth or neither?
Disclosure: WisdomTree Europe
This material is prepared by WisdomTree and its affiliates and is not intended to be relied upon as a forecast, research or investment advice, and is not a recommendation, offer or solicitation to buy or sell any securities or to adopt any investment strategy. The opinions expressed are as of the date of production and may change as subsequent conditions vary. The information and opinions contained in this material are derived from proprietary and non-proprietary sources. As such, no warranty of accuracy or reliability is given and no responsibility arising in any other way for errors and omissions (including responsibility to any person by reason of negligence) is accepted by WisdomTree, nor any affiliate, nor any of their officers, employees or agents. Reliance upon information in this material is at the sole discretion of the reader. Past performance is not a reliable indicator of future performance.
Please click here for our full disclaimer.
Jurisdictions in the European Economic Area (“EEA”): This content has been provided by WisdomTree Ireland Limited, which is authorised and regulated by the Central Bank of Ireland.
Jurisdictions outside of the EEA: This content has been provided by WisdomTree UK Limited, which is authorised and regulated by the United Kingdom Financial Conduct Authority.
Disclosure: Interactive Brokers
Information posted on IBKR Campus that is provided by third-parties does NOT constitute a recommendation that you should contract for the services of that third party. Third-party participants who contribute to IBKR Campus are independent of Interactive Brokers and Interactive Brokers does not make any representations or warranties concerning the services offered, their past or future performance, or the accuracy of the information provided by the third party. Past performance is no guarantee of future results.
This material is from WisdomTree Europe and is being posted with its permission. The views expressed in this material are solely those of the author and/or WisdomTree Europe and Interactive Brokers is not endorsing or recommending any investment or trading discussed in the material. This material is not and should not be construed as an offer to buy or sell any security. It should not be construed as research or investment advice or a recommendation to buy, sell or hold any security or commodity. This material does not and is not intended to take into account the particular financial conditions, investment objectives or requirements of individual customers. Before acting on this material, you should consider whether it is suitable for your particular circumstances and, as necessary, seek professional advice.


