


Prior to yesterday’s modest rally, propped up by a bout of furious last-minute buying, the S&P 500 Index (SPX) had experienced five down days in a row. The declines of last Thursday and Friday were quite modest, but the drops on Monday and Tuesday were about 1.5% each. The questions arose – what went wrong this week? – but my opinion is that nothing truly unusual occurred. Instead, the unusual event was the outsize reaction to Chair Powell’s address to the Brookings Institution on November 30th, and this week’s declines were more about recognition that traders might have gotten ahead of themselves.
A two-week chart makes the round trip quite obvious:
SPX 2-Week Chart, 10-Minute Bars
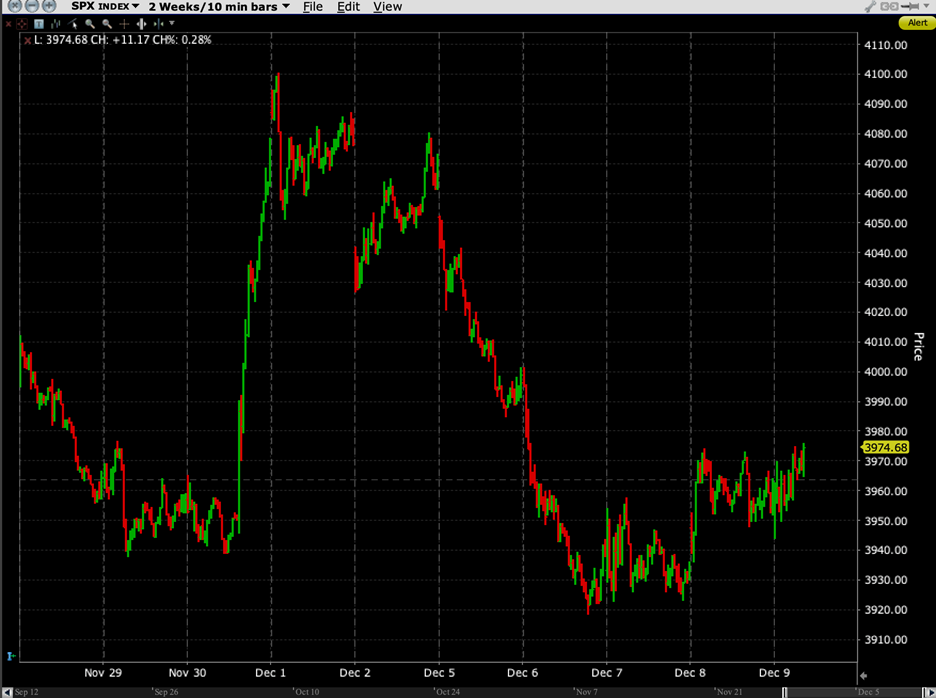
Source: Interactive Brokers
On the day after the speech, we noted that there was little new information to spur a sizeable jump other than a pleasant “Goldilocks” tone in Powell’s remarks. The rally was abetted by month-end factors and some aggressive call buyers, which no doubt made the burst more explosive. Over the coming days, when the hoped-for follow-through failed to arrive, we simply consolidated the rally and turned lower once again.
Much was made about the fact that SPX closed above its 200-day moving average. The attention was understandable. The 200-day capped August’s rally quite neatly, with SPX failing to break higher, only to get kneecapped a couple of weeks later by Powell’s Jackson Hole speech. This time, the 200-day offered no significant resistance to the gamma-fueled rally, so it consequently offered only a day’s worth of support on the way down. The chart below shows the both the past significance of the 200-day and the current significance of the 100-day moving averages:
SPX, 6-Months, Daily Bars with 50-Day (purple), 100- Day (blue), 200-Day (yellow) Moving Averages
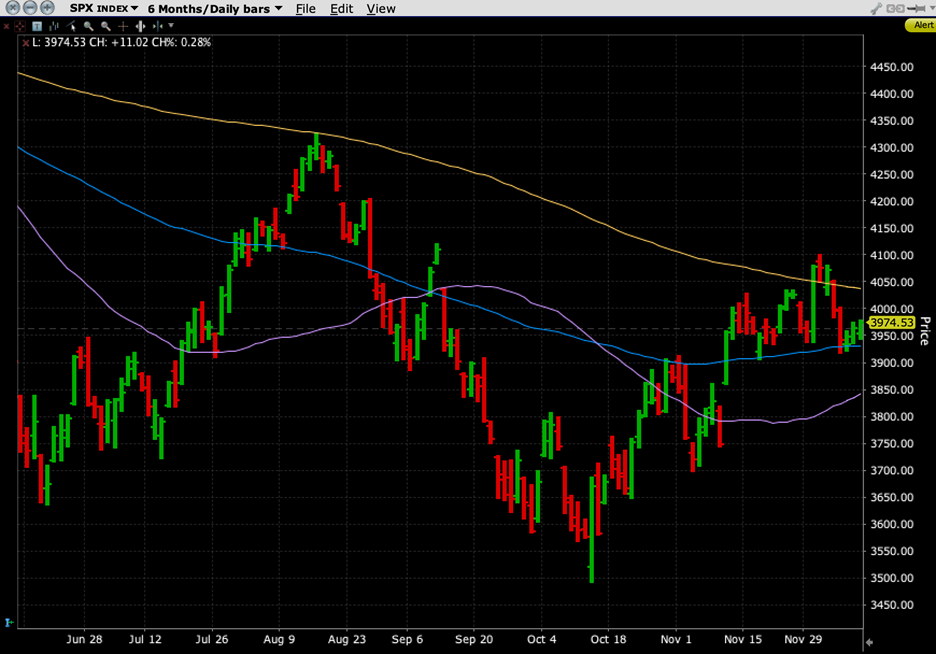
Source: Interactive Brokers
A key factor in this week’s declines was the recognition that recessionary forces could be problematic for equities. The bond market continues to point to a potentially imminent recession, with the 2-10 inversion at levels not seen since 1981. Bank CEO’s told a gloomy story. Oil fell despite the easing of Chinese covid restrictions, the positive effects of which might have been another “buy the rumor / sell the news” event.
Also, volatility measures returned to more normal levels. By late last week we saw VIX and implied volatilities on key index options sink to rather complacent levels by recent standards. It was as though the enthusiasm slowly morphed back to a recognition that next week contains an FOMC meeting and a quarterly expiration. Either or both could be sources of volatility. The chart below shows just how the implied volatilities for SPX options expiring next week have jumped from about 21 to almost 30 over the past few sessions:
SPX Implied Volatility Term Structure, Today (yellow) vs. 1-Week Ago (red)
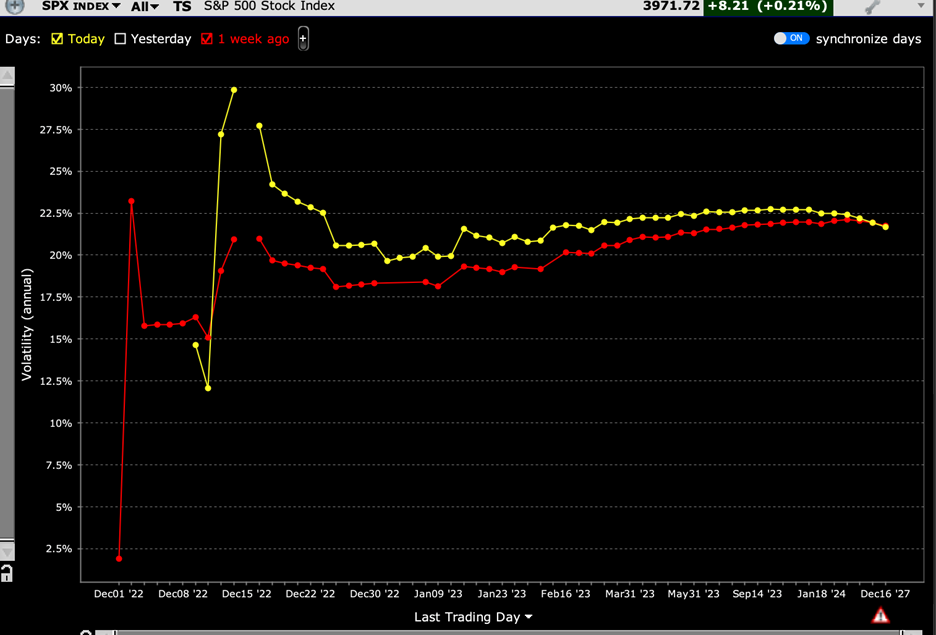
Source: Interactive Brokers
Longer-term implied volatility also rose, but that move pales in comparison to the jump higher in the days most directly affected by the FOMC meeting and expiration.
As I write this, we see SPX and other measures trying to move cautiously higher in spite of a negative surprise in PPI. On a month-over-month basis, headline PPI rose 0.3% and the core rate rose 0.4%, above consensus by 0.1% and 0.2% respectively. That certainly doesn’t paint a rosy picture for central bankers who continually reaffirm their commitment to fight inflation. Yet many traders are hopeful for a solid end to the year, so they reminded themselves that PPI numbers usually take a backseat to CPI (due on Tuesday). Optimists were encouraged by the University of Michigan numbers, which showed improvement in Sentiment (59.1 vs 57), Current Conditions (60.2 vs 58.8), Expectations (58.4 vs. 54.5) and 1-Year Inflation Expectations (4.6% vs. 4.95). All should be welcome to those who fear a consumer-led recession, though the following graph makes me a bit skeptical about how much of the good feelings can simply be attributed to lower gasoline prices. The inflationary expectations certainly are highly correlated:
University of Michigan 1-Year Inflation Expectations (white), Rolling Front-Month Crude Futures (blue), Rolling Front-Month Gasoline Futures (red)
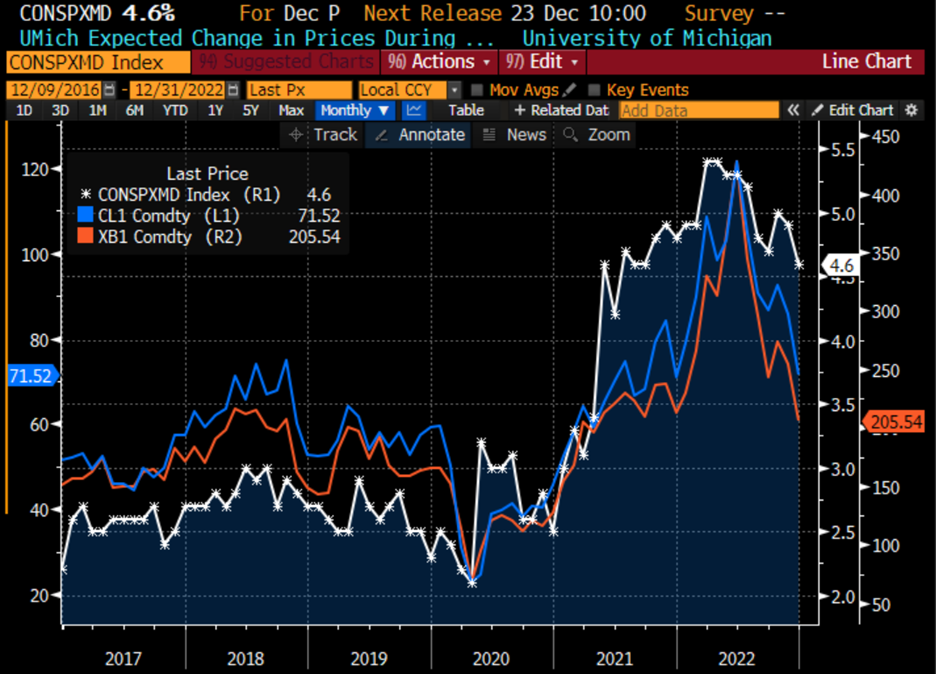
Source: Bloomberg
Remember, the Federal Reserve is concerned primarily with core inflation that excludes food and energy. The people who answer survey are clearly more influenced by the prices of the so-called non-core items. Let’s see how the FOMC addresses that distinction next week.
Disclosure: Interactive Brokers
The analysis in this material is provided for information only and is not and should not be construed as an offer to sell or the solicitation of an offer to buy any security. To the extent that this material discusses general market activity, industry or sector trends or other broad-based economic or political conditions, it should not be construed as research or investment advice. To the extent that it includes references to specific securities, commodities, currencies, or other instruments, those references do not constitute a recommendation by IBKR to buy, sell or hold such investments. This material does not and is not intended to take into account the particular financial conditions, investment objectives or requirements of individual customers. Before acting on this material, you should consider whether it is suitable for your particular circumstances and, as necessary, seek professional advice.
The views and opinions expressed herein are those of the author and do not necessarily reflect the views of Interactive Brokers, its affiliates, or its employees.
Disclosure: Futures Trading
Futures are not suitable for all investors. The amount you may lose may be greater than your initial investment. Before trading futures, please read the CFTC Risk Disclosure. A copy and additional information are available at ibkr.com.


