


I have to believe that there is no shortage of traders who want this week to be over. The mood turned ugly after dour comments by Fed Chair Powell and ECB President Lagarde and continues to weigh on US equities this morning.
But let’s put things in perspective. As of this [Friday] morning, the S&P 500 Index (SPX) is down only about 2.5% for the week. That’s only about 1% more than last week’s drop, yet this week feels much worse. The difference is the volatility.
Last week’s trading range was about 3.4% from the high (set on the open of Monday, December 5th) to the low (set on Tuesday the 6th). After the lows were set early in the week, we bounced a bit and then muddled around the 3950 range.
This week’s range (so far) is nearly 7%[i]. That wide range encompasses the excitement that accompanied the better-than-expected CPI report on Tuesday and the realization later in the week that the Federal Reserve still considers inflation sufficiently problematic to preclude cutting rates prior to the end of next year. Instead of simply muddling around, we had high hopes that were quickly dashed. A two-week chart makes the wider range obvious:
SPX 2-Week Chart, 5-Minute Bars
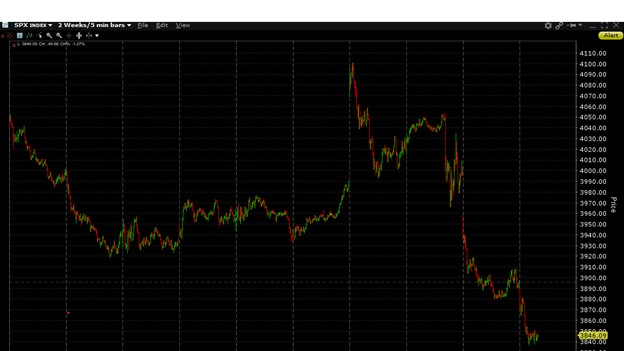
Source: Interactive Brokers
It’s not like the volatility should have come as a surprise though. On Monday we wrote:
On Tuesday we have the CPI report for November. On Wednesday we have an FOMC meeting. On Thursday the ECB follows the Fed with their own rates announcement. And on Friday we have a quarterly expiration of futures and options. Any of those could get markets moving. We get all of them in a week when many investors are trying to think ahead to holidays and ending a tricky year.
Of course, it turns out that ALL those factors got the market moving.
Another source of the current gloom could be that some key technical levels broke down over the past two days. In the chart below, pay special attention to the trend line at the bottom right, and the 100-day moving average (blue) that currently sits between the 50-day (yellow) and 200-day (purple) moving averages:
SPX 1-Year Chart, Daily Bars (red/green) with 50-Day (yellow), 100-Day (blue), 200-Day (purple) Moving Averages, and Trendline (white)
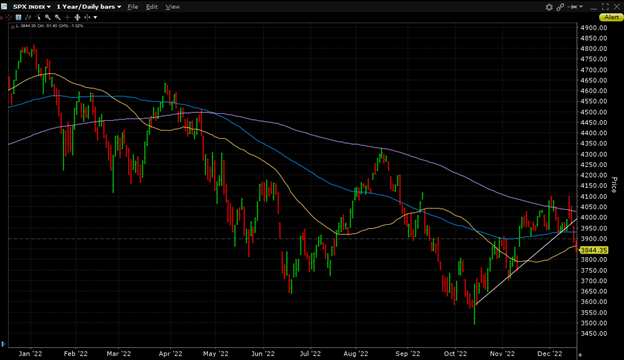
Source: Interactive Brokers
Unfortunately for traders with long positions who utilize technical analysis, two things went wrong this week. In the aftermath of the FOMC meeting on Wednesday, we were perched atop both the 100-day moving average — which has provided solid support since being breached on the upside over a month ago – and a trendline that has supported the rally off the October lows. Both were breached yesterday without much trouble.
Some, but hardly all, the blame can be placed upon the effect of today’s quarterly expiration of futures and options. As we have noted previously, expiring options can act either as a slingshot or magnet. Yesterday there was significant open interest in SPX options that expired on this morning’s open: about 325,000 on the 4,000 line, about 145,000 on the 3,950 line, and about 115,000 on the 3,900 line. The 4,000 level was breached on Wednesday, so that never really came into play yesterday, and the selling quickly overcame any efforts to hold the 3,950 area. The 3,900 level became the focus of trading for most of yesterday afternoon as a result. Thanks to overseas markets that were trading mostly lower, we came into today’s session with a negative bias that accelerated as the morning wore on. Although we are currently flirting with the 50-day moving average, it is important to note that neither the 50-day nor the 200-day moving averages have provide much in the way of support or resistance recently.
The logical question is: what happens next? Over the past few days, I’ve been asked numerous times about whether we’ll get a so-called “Santa Claus” rally. Based on the technical picture we discussed, one would normally expect a near-term rally to be constrained by the same trendline and 100-day moving average that provided support before failing. But the last two weeks of the year – particularly the final one – tend to be anything but normal. Volumes and liquidity tail off into the year’s end, meaning it doesn’t take much to move the markets in one direction or another – sometimes with little fundamental logic. In normal years, more often than not we see a rally during this end of year period. But this has been anything but a normal year.
—
[i] The range was an even wider 8% in ES futures because a huge pre-market spike immediately after the CPI report.
Disclosure: Interactive Brokers
The analysis in this material is provided for information only and is not and should not be construed as an offer to sell or the solicitation of an offer to buy any security. To the extent that this material discusses general market activity, industry or sector trends or other broad-based economic or political conditions, it should not be construed as research or investment advice. To the extent that it includes references to specific securities, commodities, currencies, or other instruments, those references do not constitute a recommendation by IBKR to buy, sell or hold such investments. This material does not and is not intended to take into account the particular financial conditions, investment objectives or requirements of individual customers. Before acting on this material, you should consider whether it is suitable for your particular circumstances and, as necessary, seek professional advice.
The views and opinions expressed herein are those of the author and do not necessarily reflect the views of Interactive Brokers, its affiliates, or its employees.
Disclosure: Options Trading
Options involve risk and are not suitable for all investors. Multiple leg strategies, including spreads, will incur multiple commission charges. For more information read the "Characteristics and Risks of Standardized Options" also known as the options disclosure document (ODD) or visit ibkr.com/occ


