


Here is a brief guide on what is a golden cross in stocks.
The golden cross is a term among traders and investors to refer to a particular stock chart pattern. It is known to be a bullish signal. It suggests that the stock price may be ready for an upward movement. In this article, we will explore what the golden cross is in stocks, and how it works.
What Is Technical Analysis?
Technical analysis is a method of analyzing financial markets by studying price and volume data over time. Analysts look for patterns in the data that indicate changes in investor sentiment or underlying fundamentals. These patterns are known as technical indicators. Traders use these to make predictions about what might happen next in the market.
What Is The Golden Cross?
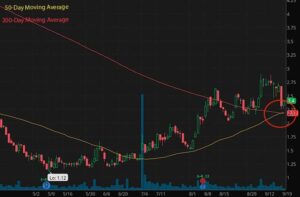
The Golden Cross is a term used in the stock market. It is used to describe a situation in which the short-term moving average of a stock, such as the 50-day moving average, crosses above its long-term moving average, such as the 200-day moving average.
Stock market investors consider this to be a bullish signal. It indicates that the stock may be poised for a period of upward momentum. Some investors use the Golden Cross as a buying signal. While others use it as a confirmation of a stock’s strength after it has already begun to move higher.

Source: PennyStocks.com
How To Use The Golden Cross Effectively?
The golden cross can serve as an important tool when it comes to making informed trading decisions. By keeping an eye out for this pattern on your charts, you will be able to identify potential opportunities much earlier on. Rather than if you were relying solely on traditional indicators such as volume and price action.
Additionally, you can use the golden cross in combination with other technical indicators. For example, support/resistance levels or trend lines to further confirm your trading decisions. Finally, taking into account any macroeconomic factors at play (such as economic news releases). You will have even more information at your disposal. This will help you when deciding whether or not to take advantage of any potential opportunities presented by this chart pattern.
What Else Can The Golden Cross Tell Us?
In addition to indicating possible trend changes in stocks, the golden cross can also tell us something about investor sentiment in relation to a particular stock or sector. If there is an increase in buying activity around a stock after the occurrence of a golden cross, it could indicate that investors have positive feelings toward it and expect its price to rise in the future.
On the other hand, if there isn’t much buying activity around a stock following a golden cross, it could indicate that investors are more cautious or unsure about its future prospects.
Bottom Line
The golden cross is one of many technical analysis tools available for traders and investors alike. When used correctly, it can provide valuable insight into potential market movements. As well as help you make better trading decisions by providing accurate information about where stocks might be moving next.
However, it’s important to remember that you should never rely on one single indicator exclusively. Instead, use multiple tools together (such as support/resistance levels and trend lines) along with any relevant macroeconomic news releases to make well-informed trading decisions every time.
—
Originally Posted December 10, 2022 – What Is The Golden Cross In Stocks?
Disclosure: Interactive Brokers
Information posted on IBKR Campus that is provided by third-parties does NOT constitute a recommendation that you should contract for the services of that third party. Third-party participants who contribute to IBKR Campus are independent of Interactive Brokers and Interactive Brokers does not make any representations or warranties concerning the services offered, their past or future performance, or the accuracy of the information provided by the third party. Past performance is no guarantee of future results.
This material is from StockMarket.com and is being posted with its permission. The views expressed in this material are solely those of the author and/or StockMarket.com and Interactive Brokers is not endorsing or recommending any investment or trading discussed in the material. This material is not and should not be construed as an offer to buy or sell any security. It should not be construed as research or investment advice or a recommendation to buy, sell or hold any security or commodity. This material does not and is not intended to take into account the particular financial conditions, investment objectives or requirements of individual customers. Before acting on this material, you should consider whether it is suitable for your particular circumstances and, as necessary, seek professional advice.


