

")


In theory, yield curves should be upward sloping, with longer rates higher than shorter rates. Investors usually demand higher returns when they commit their money for longer periods. This includes most financial services, where the core business is to “borrow short, lend long.” A stable financial system depends on it.1
Every so often, however, the yield curve inverts. The reason is usually fear of an impending recession. Take today’s rate environment for example. The Federal Reserve raised its benchmark interest rate target to 4.50% – 4.75% on February 1. The goal of current Fed policy is to lower inflation, a key driver of long-term interest rates. Meanwhile, many traders believe an economic recession is likely at some point in 2023, and they believe this would result in the Fed reversing course and lowering interest rates. Both outcomes would mean lower interest rates in the future. This can be seen in Figures 1 and 2, which show the current yield curve and the implied fed funds rates (based on futures prices) through 1/31/2024.2
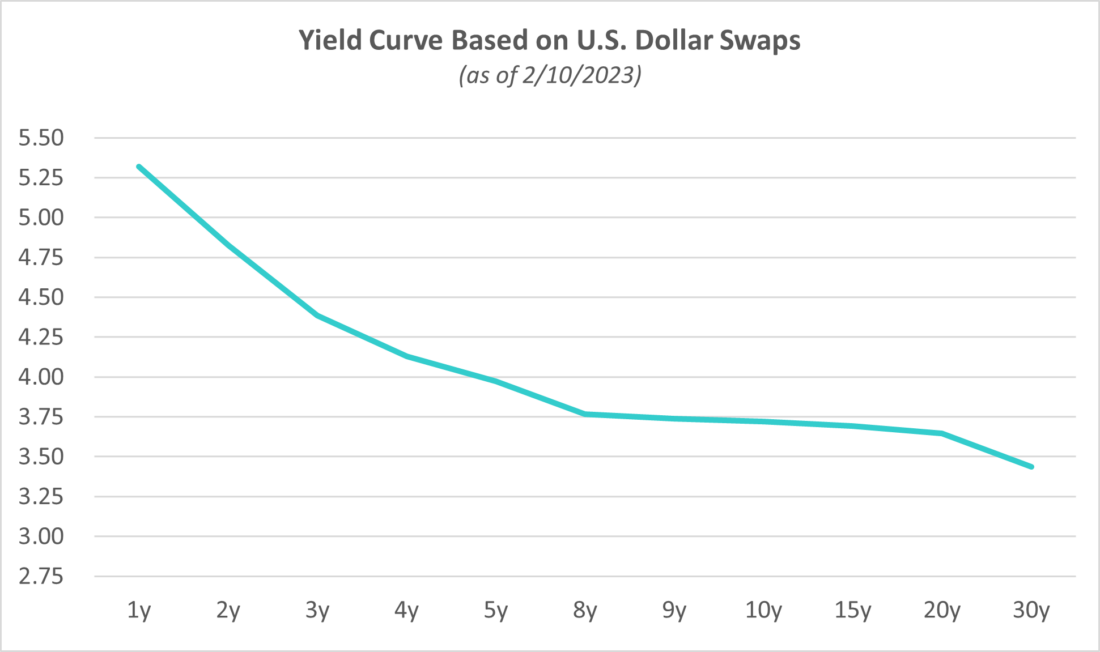
Figure 1: U.S. Interest Rate Swaps curve as of 2/1/2023 (Source: Bloomberg Finance, LP)
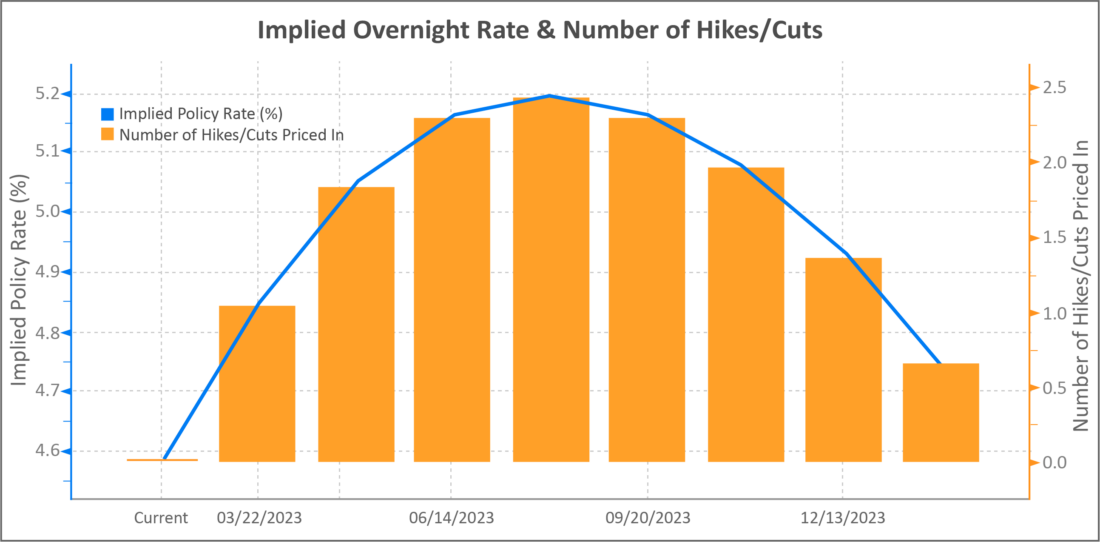
Figure 2: Implied fed funds overnight rates and number of interest rate hikes/cuts through 2/10/2023 (Source: Bloomberg Finance, LP)
As a result, many investors are increasing their exposure to long-term Treasuries, as small downward moves in interest rates have large positive moves on price. This approach can work, especially in the short term, if rates decline as expected. However, a deeper look at today’s markets reveals an environment that may be set up more favorably for short-term bonds and in which owning duration may be riskier than it seems.
It Helps to Be a Forward Thinker
Though long-term rates are clearly lower than short-term rates currently, what is not as obvious is how the market expects interest rates to change over time. We believe knowing what is already priced in is key to understanding where the potential may be for unexpected and unpleasant surprises. To that end, Figure 3 shows the forward market expectations for the yield curve in 2 years and in 5 years. In summary, traders appear to be projecting a yield curve, which flattens in two years and stays flat for another few years after that.
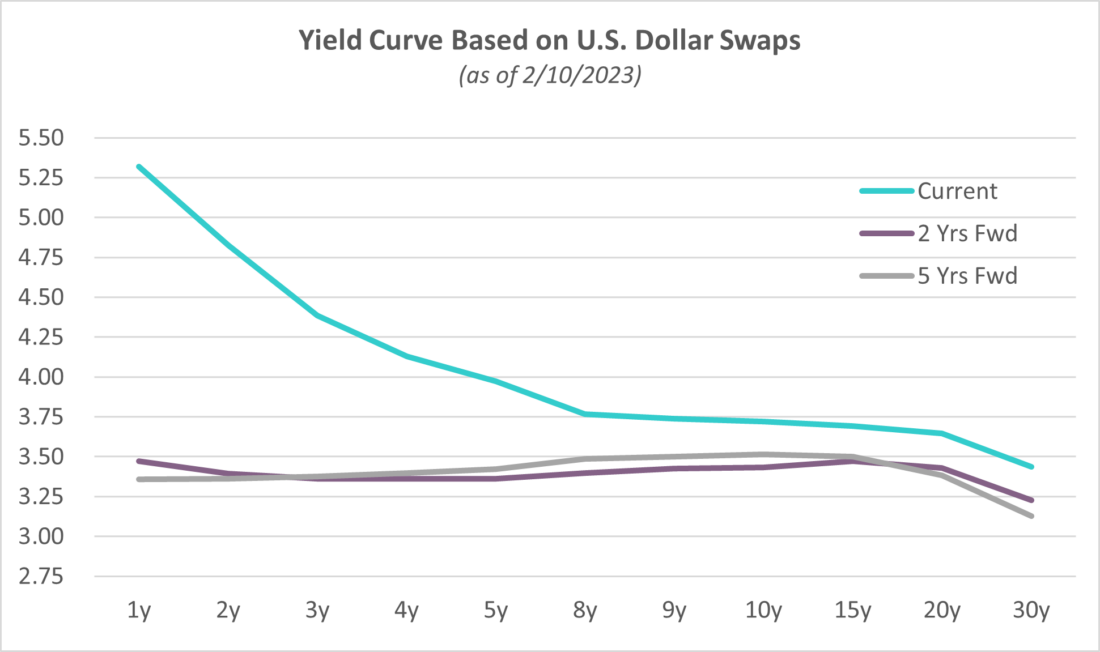
Figure 3: Current, implied 2-year forward and implied 5-year forward yield curves based on current U.S. Interest Rate Swaps curve as of 2/10/2023 (Source: Bloomberg Finance, LP)
It has been our experience that inverted yield curves eventually return to an upward slope and that flat yield curves are often a rest stop on the way. That the market has for now stopped short in predicting the eventual steepening is reflective of the uncertainty facing investors today. Fortunately, visualizing the forward curves allows us to consider the likelihood of various potential outcomes more clearly.
For example, the expected flattening notably takes place because the short end of the curve comes down, which is broadly consistent with the fed funds rate projections from Figure 2. Specifically, traders seem to expect the 1-year swap rate to drop to around 3% in just two years, versus 5.25% today. On the surface, we understand that the projections for the fed funds rate may be tracking inflation expectations, and it is reasonable to think that, either due to recession or Fed skill, inflation could be below 3% at that time.
However, if they are correct and inflation and short-term rates do fall to that level, we would expect the yield curve to normalize. Both scenarios point to forward-looking growth expectations, through either economic recovery or by dodging a recession altogether. These outcomes, in our view, are inconsistent with an upward sloping yield curve in which short-term rates are lower than the 3% forward rates currently priced in. Rather, we expect long-term rates would rise. If that is the case, then investors’ expected returns might not materialize and may even go the wrong way, depending on how much steepness the curve experiences.
Head to Higher Ground
We believe there are structural reasons why lower short-term interest rates may not happen anytime soon.3 Fed Chairman Jay Powell has clearly broadcast an unwillingness to return to the near-zero interest rate policies that contributed to the rampant inflation we see today. We think it would take a severe economic downturn to change that stance. Given the resilience of the economy despite the Fed’s hawkish policies over the last 6 months, we do not believe that outcome to be likely either.4
As a result, it is possible that the yield curve could stay inverted for a prolonged period as the Fed continues to battle strong consumer demand and historically low unemployment.5 Meanwhile, investors are likely to remain worried about a deep recession triggered by a determined and increasingly aggressive Fed. If this is the case, long-term rates could stay low for some time, and traders have already priced in additional declines in long-term interest rates as we see in Figure 3. The case for pricing in further declines, then, is a paradoxical scenario: inflation remains high, the Fed overstays its welcome (a real possibility), economic indicators remain strong, yet the market continues to expect a dire outcome for economic growth, which would cause long-term interest rates to go below 3%. In our opinion, this is an unlikely combination of potentially contradictory circumstances to say the least.
To be clear, the rate decline that is already priced in, were it to happen, would still result in some price appreciation, but that is not our base case and exposes investors if market expectations turn out to be wrong. We do not see significant upside to a bet that interest rates will decline below what is already being priced into the markets. We do see significant potential downside in longer-term debt when the yield curve normalizes. We think the odds favor a steepening of the yield curve in which long-term rates rise, or at best, stay flat.
Short Term for the Duration
So where should fixed income investors turn? Short duration bonds offer investors the potential to construct a portfolio without the risk of being wrong about whether the forward curves are correct. If they are, lower short-term rates, receding recession fears, and a flat yield curve should benefit both short-term bonds and credit spreads. Meanwhile, if the yield curve stays inverted for a prolonged period, investors may be underestimating the income that can be earned by short-term and floating-rate bonds, since current yield expectations are based on an assumption of lower short-term rates within the next year. The potential to earn one’s return through current income rather than a directional view on interest rates, to us, seems a more prudent and consistent way to preserve capital in a fixed income allocation. This yield curve uncertainty may be with us for several years, and we prefer the bird in hand rather than chasing two in the bush.
1 Financial profits are essentially the difference between interest income and the company’s cost of capital. If a yield curve is upward sloping, the difference between short-term borrowing (e.g., fed funds) and long-term loans (e.g., prime mortgage rates) can result in profits without high long-term credit spreads. If a yield curve is not upward sloping, a bank would need to lend to riskier credits and earn higher credit spreads to make sure interest income exceeded interest expense, which we view as a destabilizing risk profile.
2 Note that, for this discussion, “yield curve” refers to the U.S. swap rate curve rather than the Treasury yield curve. The U.S. interest rate swaps market is much larger (in notional terms) than the U.S. Treasury market, and the wider variety of maturities available through swaps allows for some interesting takeaways.
3 We explore one such scenario in our recent webinar, “Welcome Back, Income.”
4 Taking a longer-term view, mankind has, with the exception of the past 14 years or so, managed well with interest rates between 3% and 6% for the past 5000 years, according to research from the Bank of England. We believe that the ability to adjust to higher rates is on our side of history.
5 The current period of yield curve inversion is the second longest since the inflation crisis of the late 1970s/early 1980s (second only to a nearly yearlong period that culminated in the collapse of the dot-com bubble in late 2000) and seems on pace to become the longest since 1981 in a few months. In markets where “unprecedented” seems more a rule than an exception, we do not think it wise to bet against the current yield curve defying the markets and many economists even further.
—
Originally Posted February 15, 2023 – Unexpected Risks and Opportunities from the Inverted Yield Curve
This commentary contains the current opinions of the authors as of the date above and is subject to change at any time. These opinions are not intended to be a forecast of future events, a guarantee of future results, or investment advice. This commentary has been distributed for informational purposes only and is not a recommendation or offer of any particular security, strategy or investment product. Information contained herein has been obtained from sources believed to be reliable, but is not guaranteed.
No part of this article may be reproduced in any form, or referred to in any other publication, without the express written permission of Osterweis Capital Management.
A yield curve is a graph that plots bond yields vs. maturities, at a set point in time, assuming the bonds have equal credit quality. In the U.S., the yield curve generally refers to that of Treasuries.
The fed funds rate is the rate at which depository institutions (banks) lend their reserve balances to other banks on an overnight basis.
Treasuries are securities sold by the federal government to consumers and investors to fund its operations. They are all backed by “the full faith and credit of the United States government” and thus are considered free of default risk.
Duration measures the sensitivity of a fixed income security’s price (or the aggregate market value of a portfolio of fixed income securities) to changes in interest rates. Fixed income securities with longer durations generally have more volatile prices than those of comparable quality with shorter durations.
The Osterweis Funds are available by prospectus only. The Funds’ investment objectives, risks, charges and expenses must be considered carefully before investing. The summary and statutory prospectuses contain this and other important information about the Funds. You may obtain a summary or statutory prospectus by calling toll free at (866) 236-0050, or by visiting the literature page. Please read the prospectus carefully before investing to ensure the Fund is appropriate for your goals and risk tolerance.
Mutual fund investing involves risk. Principal loss is possible. The Osterweis Short Duration Credit Fund and Osterweis Sustainable Credit Fund may invest in debt securities that are un-rated or rated below investment grade. Lower-rated securities may present an increased possibility of default, price volatility, or illiquidity compared to higher-rated securities. Investments in debt securities typically decrease in value when interest rates rise. This risk is usually greater for longer-term debt securities. The Funds may invest more than 5% of their total assets in the securities of one or more issuers. Fundamental investing in companies demonstrating a focus on long-term sustainability may cause the Funds to forgo exposure to certain companies, industries, or sectors, and may result in deviations relative to its benchmark causing Fund performance to be more or less sensitive to those sectors. There is no guarantee the Adviser will make investments in companies that result in favorable Environmental Social Governance (ESG) outcomes. Additionally, the Sustainable Credit Fund is non-diversified.
Osterweis Capital Management is the adviser to the Osterweis Funds, which are distributed by Quasar Distributors, LLC. [OSTE-20230213-0788]
Disclosure: Interactive Brokers
Information posted on IBKR Campus that is provided by third-parties does NOT constitute a recommendation that you should contract for the services of that third party. Third-party participants who contribute to IBKR Campus are independent of Interactive Brokers and Interactive Brokers does not make any representations or warranties concerning the services offered, their past or future performance, or the accuracy of the information provided by the third party. Past performance is no guarantee of future results.
This material is from Osterweis Capital Management and is being posted with its permission. The views expressed in this material are solely those of the author and/or Osterweis Capital Management and Interactive Brokers is not endorsing or recommending any investment or trading discussed in the material. This material is not and should not be construed as an offer to buy or sell any security. It should not be construed as research or investment advice or a recommendation to buy, sell or hold any security or commodity. This material does not and is not intended to take into account the particular financial conditions, investment objectives or requirements of individual customers. Before acting on this material, you should consider whether it is suitable for your particular circumstances and, as necessary, seek professional advice.

