


By Todd Stankiewicz CMT, CFP, ChFC
1/ Changing Yield Curve Opportunities
2/ Long Bond Bullish Divergence
3/ Seasonality
4/ Investor Sentiment
Investopedia is partnering with CMT Association on this newsletter. The contents of this newsletter are for informational and educational purposes only, however, and do not constitute investing advice. The guest authors, which may sell research to investors, and may trade or hold positions in securities mentioned herein do not represent the views of CMT Association or Investopedia. Please consult a financial advisor for investment recommendations and services.
1/ Changing Yield Curve Opportunities

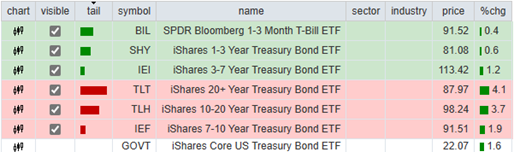
The Relative Rotation Graph (RRG) of the treasury yield curve shows the relative performance across the curve may be changing. Back on October 3, I posted a similar RRG showing the extreme underperformance of long duration treasuries vs the outperformance of short duration treasuries.
Since this time, we have seen a major shift across the curve. While long duration is still underperforming, there has been a marked improvement in which the tail is starting to reflect a clockwise rotation towards the improving quadrant.
The short-term treasury positions are now breaking down towards the weakening quadrant. If this rotation persists, it may suggest that there is opportunity in extended out on the yield curve.
2/ Long Bond Bullish Divergence
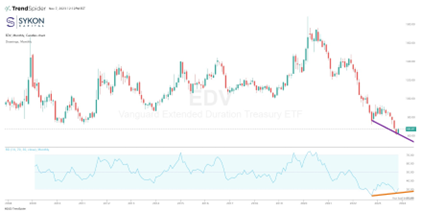
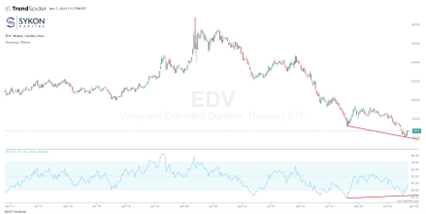
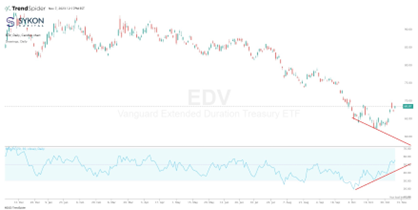
One of the longest duration Treasury bond ETFs is the Vanguard Extended Duration Treasury ETF, EDV. Above are three different time frame charts for this ETF. The top Chart represents the monthly chart. The middle is the weekly and the bottom is the daily chart of EDV.
Across each of these time frames we can see that there is a Bullish Relative Strength Index (RSI) divergence. This is where the price of the position is moving to a new low, but the RSI made a higher low. Along with this divergence, EDV reached oversold conditions in each of the accompanying scenarios.
This may support a bounce in EDV over all time frames. But there is significant overhead resistance at the 74.30 price level. The response at each resistance level will be important to determine if the bounce has legs to run or is just an oversold reaction.
3/ Seasonality
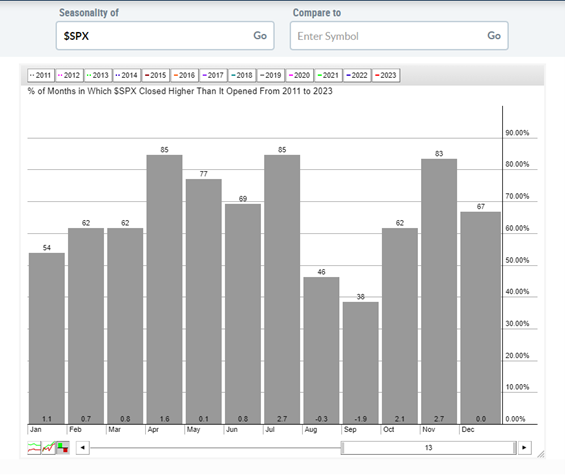
Over the last 13 years, November has been one of the best months of the year for both stocks and bonds. The top chart is the seasonality pattern of the S&P500 index of the last 13 years, since the Great Financial Crisis. In November, the index closed higher 83% of the time with an average gain of 2.7%. November is only surpassed by July as the best month for the index during this time frame.
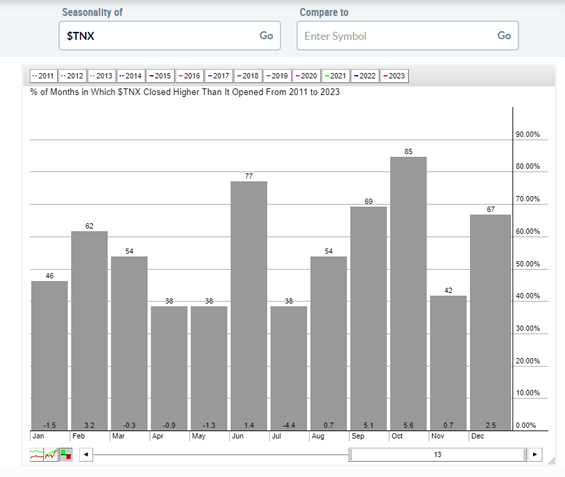
The bottom chart if the seasonality pattern of the Ten-Year Treasury Yield over the last 13 years. In November, the yield of the 10-year Treasury Bond closed higher only 42% of the time. Since bond prices move inversely to yields, this means that the price of the treasury closes higher 58% of the time.
Collectively this means that November can be one of the best months for a large cap stock and bond portfolio aside from July based on historical seasonality patterns.
4/ Investor Sentiment
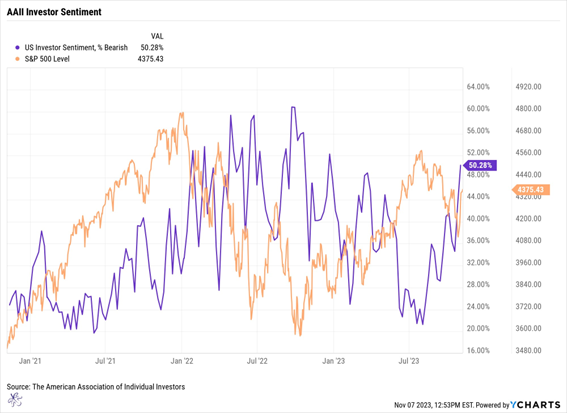
Just last week the AAII investor sentiment Bears reached 50.28%. This was the highest reading of 2023. The AAII Bear level is indicated by the purple line. The orange line is the S&P500 index. This sentiment index often acts as a contrarian indicator. Often the Purple line can be seen spiking at bottoms on the S&P500 index, even if it is just a short-term bottom. In line with previous occurrences, last week was one of the best weeks of the year for the S&P500 index as it bounced higher on oversold and extreme pessimism.
Conversely, periods of very low bear levels are often equated to tops in the equity index. This suggests that as long as this bear levels stay elevated there can be an opportunity for the index to continue higher. Due to the contrarian nature of this indicator, It may be prudent to be cautious if the level of bearish sentiment drops to historically low levels.
—
Originally posted 8th November 2023
Disclosure: Investopedia
Investopedia.com: The comments, opinions and analyses expressed herein are for informational purposes only and should not be considered individual investment advice or recommendations to invest in any security or to adopt any investment strategy. While we believe the information provided herein is reliable, we do not warrant its accuracy or completeness. The views and strategies described on our content may not be suitable for all investors. Because market and economic conditions are subject to rapid change, all comments, opinions and analyses contained within our content are rendered as of the date of the posting and may change without notice. The material is not intended as a complete analysis of every material fact regarding any country, region, market, industry, investment or strategy. This information is intended for US residents only.
Disclosure: Interactive Brokers
Information posted on IBKR Campus that is provided by third-parties does NOT constitute a recommendation that you should contract for the services of that third party. Third-party participants who contribute to IBKR Campus are independent of Interactive Brokers and Interactive Brokers does not make any representations or warranties concerning the services offered, their past or future performance, or the accuracy of the information provided by the third party. Past performance is no guarantee of future results.
This material is from Investopedia and is being posted with its permission. The views expressed in this material are solely those of the author and/or Investopedia and Interactive Brokers is not endorsing or recommending any investment or trading discussed in the material. This material is not and should not be construed as an offer to buy or sell any security. It should not be construed as research or investment advice or a recommendation to buy, sell or hold any security or commodity. This material does not and is not intended to take into account the particular financial conditions, investment objectives or requirements of individual customers. Before acting on this material, you should consider whether it is suitable for your particular circumstances and, as necessary, seek professional advice.
Disclosure: ETFs
Any discussion or mention of an ETF is not to be construed as recommendation, promotion or solicitation. All investors should review and consider associated investment risks, charges and expenses of the investment company or fund prior to investing. Before acting on this material, you should consider whether it is suitable for your particular circumstances and, as necessary, seek professional advice.


Join The Conversation
If you have a general question, it may already be covered in our FAQs. If you have an account-specific question or concern, please reach out to Client Services.