

")


When I first began working, everyone used to watch their Quotrons very closely on Thursday afternoons at 4:30. That was when the key data point was released – the weekly money supply data. Thanks to Paul Volcker, Milton Friedman, and a whole bunch of other prominent figures, monetarism was a key focus of academics and investors alike. Several decades later, although many of us look for the Federal Reserve weekly H.4.1 reports, which detail the size and composition of the Fed’s balance sheets, few of us pay much attention to the (now monthly) money supply reports.
The basic premise of monetarist theory is this equation:
MV=PQ
M = Money Supply
V = Velocity
P = Price Level
Q = Quantity of Goods Produced
It is of course an oversimplification, but it became an easy way for people to understand the root of the price pressures that the economy was withstanding at the time. On the surface, it is easy to visualize that if the quantity of goods that an economy can produce, and the velocity of money (the number of times a dollar changes hands, for example) are relatively fixed or difficult to change in a short period of time, then an increase in money supply should lead to higher prices. Since inflation means that more currency is required to buy some amount of goods or services, it stands to reason that if we have more money in circulation then we will see higher prices.
We can see that money supply rose slowly in the 1960’s, more quickly in the 1970’s and 1980’s, stalled a bit in the ‘90s, then generally rose exponentially, with a huge jump in the covid-era.
M2 Money Supply Since 1959
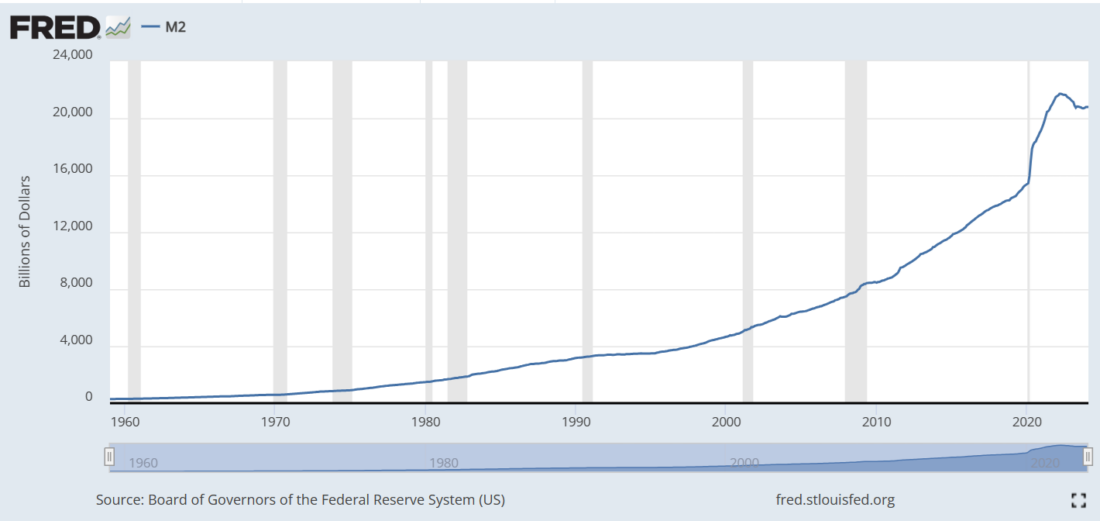
Source: St. Louis Fed
But look at the current period – it’s flat!
M2 Money Supply – Past 5 Years

Source: St. Louis Fed
One could certainly make the case that the accelerated growth in the money supply played a key role in boosting asset prices in the years that followed 2008’s global financial crisis. But why didn’t it cause much inflation? During that period, the velocity of money came under pressure. It had typically been a relative constant when monetarism was in vogue. That number is generally a plug-in anyway, derived from the other three variables in the equation since it is essentially impossible to measure. That means that other factors outside the simple equation — like globalization — played a key role in reducing price pressures until the covid shock. That is one reason that monetarism fell out of favor. It wasn’t doing a great job in explaining the relationship between money supply and inflation.
Thus, even though we had a twelve year span when prices in the economy were stable, the fact that equities and other assets appreciated steadily implied that whatever inflation was out there was actually being felt on Wall Street, not Main Street. And that was a very good thing for investors. But if rising money supply helped boost asset markets, how do we account for the recent decline and current stagnation?
Well, the decline in money supply during 2022 coincided with a sharp decline in stock prices. Few investors want to see a re-run of that period. Since then, stocks have recovered and thrived. It could of course be the case that the relatively elevated level of M2 is sufficient to enable asset prices to rise – as long as the supply stays stable and doesn’t resume its fall. That’s what we have to hope for. If not, then Mr. M2 will again matter in an unpleasant manner.
Disclosure: Interactive Brokers
The analysis in this material is provided for information only and is not and should not be construed as an offer to sell or the solicitation of an offer to buy any security. To the extent that this material discusses general market activity, industry or sector trends or other broad-based economic or political conditions, it should not be construed as research or investment advice. To the extent that it includes references to specific securities, commodities, currencies, or other instruments, those references do not constitute a recommendation by IBKR to buy, sell or hold such investments. This material does not and is not intended to take into account the particular financial conditions, investment objectives or requirements of individual customers. Before acting on this material, you should consider whether it is suitable for your particular circumstances and, as necessary, seek professional advice.
The views and opinions expressed herein are those of the author and do not necessarily reflect the views of Interactive Brokers, its affiliates, or its employees.


Join The Conversation
If you have a general question, it may already be covered in our FAQs. If you have an account-specific question or concern, please reach out to Client Services.