


")


In this post, we’re going to cover how to plot XGBoost trees in R. XGBoost is a very popular machine learning algorithm, which is frequently used in Kaggle competitions and has many practical use cases.
Let’s start by loading the packages we’ll need. Note that plotting XGBoost trees requires the DiagrammeR package to be installed, so even if you have xgboost installed already, you’ll need to make sure you have DiagrammeR also.
# load libraries
library(xgboost)
library(caret)
library(dplyr)
library(DiagrammeR)
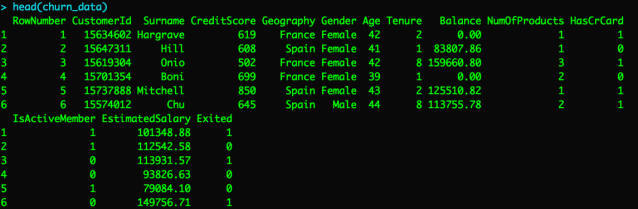
Next, let’s read in our dataset. In this post, we’ll be using this customer churn dataset. The label we’ll be trying to predict is called “Exited” and is a binary variable with 1 meaning the customer churned (canceled account) vs. 0 meaning the customer did not churn (did not cancel account).
# read in dataset
churn_data <- read.csv("Churn_Modelling.csv")
Preparing the dataset for modeling
Now, let’s prep our dataset for modeling. First, we’ll remove a few variables we don’t need. Second, we’ll one hot encode each of the categorical variables. Then, we’ll split our dataset into train and validation.
# remove variables we won’t be using for modeling
need_data <- churn_data %>% select(-RowNumber, -CustomerId, -Surname)
# one hot encode all categorical variables
dummy <- dummyVars(" ~ .", data = need_data)
need_data <- data.frame(predict(dummy, newdata = need_data))
y_label <- need_data$Exited
need_data <- need_data %>% select(-Exited)
need_data <- data.frame(Exited = y_label, need_data)
# convert Exited column to a factor
need_data$Exited <- as.factor(need_data$Exited)
# split data into train / validation
set.seed(0)
indexes <- sample(1:nrow(need_data), 0.7 * nrow(need_data))
train_data <- need_data[indexes,]
val_data <- need_data[-indexes,]
Train the XGBoost model
For the purpose of this article, we’ll just vary a few of the hyperparameters using a grid search.
# create tuning grid
grid_default <- expand.grid(nrounds = c(50, 75, 100, 150, 200, 250),
max_depth = c(2, 3, 4, 5),
eta = c(0.05, 0.1, 0.15),
gamma = c(0),
colsample_bytree = c(0.7),
min_child_weight = c(5),
subsample = c(0.6))
# set random seed
set.seed(1234)
# train XGBoost model
xgb_model <- train(formula(need_data),
data = need_data,
tuneGrid = grid_default,
method = “xgbTree”,
metric = “Kappa”)
Plotting XGBoost trees
Now, we’re ready to plot some trees from the XGBoost model. We’ll be able to do that using the xgb.plot.tree function. Let’s plot the first tree in the XGBoost ensemble. Note that in the code below, we specify the model object along with the index of the tree we want to plot.
# plot the first tree
xgb.plot.tree(model = xgb_model$finalModel, trees = 1)
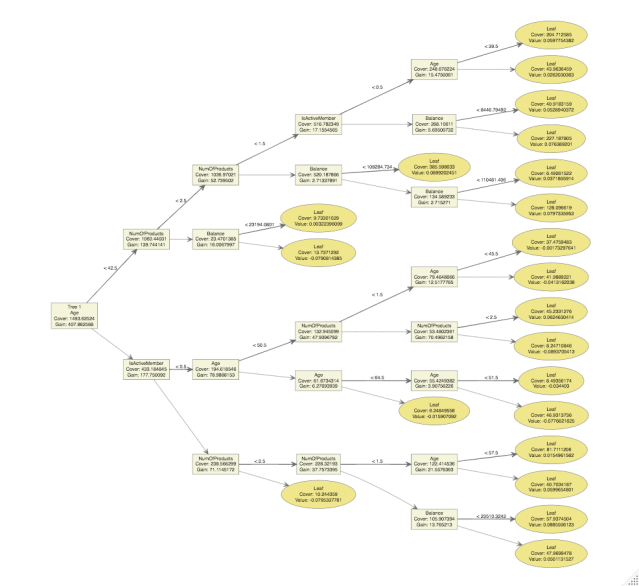
From the plot, we can see that Age is used to make the first split in the tree.
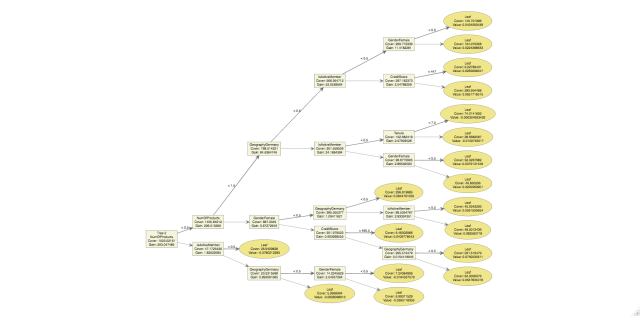
If we want to plot another tree, we can just change the tree index. For example, the line of code below plots the second tree in the XGBoost ensemble.
xgb.plot.tree(model = xgb_model$finalModel, trees = 2)
If you want to adjust the height and width of the plot, you can do that by changing the plot_height and plot_width parameters:
xgb.plot.tree(model = xgb_model$finalModel, trees = 1, plot_width = 1000, plot_height = 1000)
Exporting tree plots to a file
Plots can also be exported programmatically using the export_graph function. Note that to do this, you’ll need to set render = FALSE in the xgb.plot.tree function.
# create plot object of XGBoost tree
tree_plot <- xgb.plot.tree(model = xgb_model$finalModel, trees = 1, plot_width = 1000,
plot_height = 1000, render = FALSE)
# export plot object to file
export_graph(tree_plot, “xgboost_tree_plot.pdf”, width = 1000, height = 1000)
Plotting multiple trees at once
Rather than plotting a single tree, you can also plot multiple trees at once. You just need to pass a vector of which trees you’d like to plot. For example, the code below will plot the first three trees.
xgb.plot.tree(model = xgb_model$finalModel, trees = 1:3)
Visit TheAutomatic.net Blog for additional insight on this topic: http://theautomatic.net/2021/04/28/how-to-plot-xgboost-trees-in-r/
Disclosure: Interactive Brokers
Information posted on IBKR Campus that is provided by third-parties does NOT constitute a recommendation that you should contract for the services of that third party. Third-party participants who contribute to IBKR Campus are independent of Interactive Brokers and Interactive Brokers does not make any representations or warranties concerning the services offered, their past or future performance, or the accuracy of the information provided by the third party. Past performance is no guarantee of future results.
This material is from TheAutomatic.net and is being posted with its permission. The views expressed in this material are solely those of the author and/or TheAutomatic.net and Interactive Brokers is not endorsing or recommending any investment or trading discussed in the material. This material is not and should not be construed as an offer to buy or sell any security. It should not be construed as research or investment advice or a recommendation to buy, sell or hold any security or commodity. This material does not and is not intended to take into account the particular financial conditions, investment objectives or requirements of individual customers. Before acting on this material, you should consider whether it is suitable for your particular circumstances and, as necessary, seek professional advice.