


Value at Risk (VaR) serves as a crucial tool in the financial landscape. This statistical measure quantifies potential losses in portfolios over a specified time horizon, offering a tangible understanding of risk with a defined level of confidence. And this comprehensive guide not only provides an introduction to value at risk but a lot more that will help you dive into it.
From optimising portfolios to regulatory compliance, VaR finds widespread application. However, the journey with VaR is not without challenges, including assumptions and oversimplified views.
Looking forward, promising trends like machine learning integration and dynamic risk modelling signal a future where VaR evolves to better understand and adapt to the ever-changing currents of financial risk.
This blog covers:
- What is Value at Risk?
- Key components of Value at Risk
- Value at Risk vs. Expected Shortfall
- Where is Value at Risk applied in trading?
- Trading styles where Value at Risk is applied
- Calculation of Value at Risk
- Value at Risk and its role in risk management
- Regulatory requirements of Value at Risk
- Challenges of using Value at Risk
- Tips to overcome the challenges of using Value at Risk
What is Value at Risk?
Value at Risk (VaR) is a statistical measure widely used in financial risk management to assess the potential loss on a portfolio of financial assets over a specific time horizon, with a certain level of confidence. In simpler terms, VaR quantifies the maximum amount of loss that a portfolio could suffer within a given time frame and probability.⁽¹⁾
Example of Value at Risk
VaR is expressed as a specific dollar amount and a confidence level, such as “There is a 5% probability that the portfolio will incur losses greater than $X over the next Y days.” The calculation takes into account various factors, including the volatility of the financial instruments in the portfolio and the correlation between them.
Key components of Value at Risk
The calculation of Value at Risk (VaR) involves several key components that collectively provide a measure of the potential loss in a financial portfolio.
Here’s a brief overview of each key component:
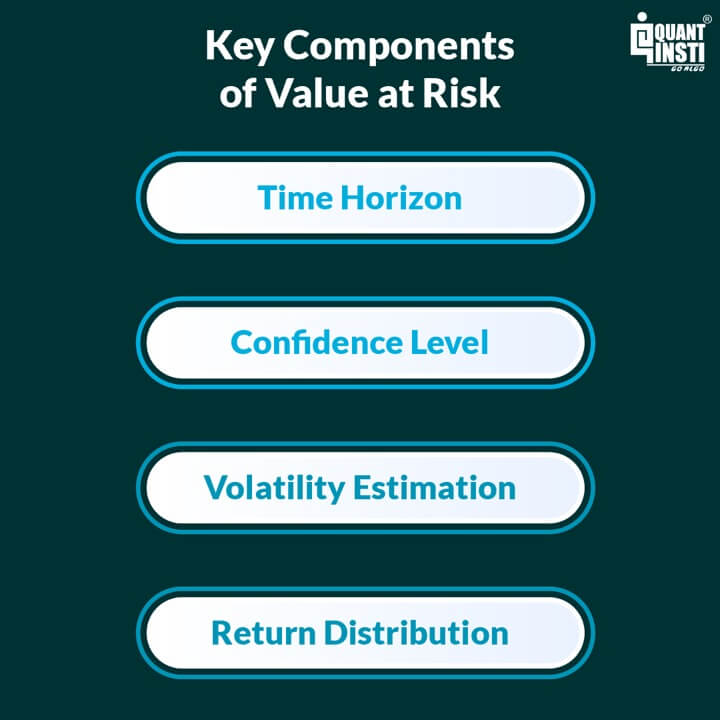
Time Horizon
The time horizon specifies the period over which VaR is calculated. It represents the length of time for which the risk is being assessed, such as one day, one week, or one month. The choice of time horizon is crucial, as it influences the sensitivity of the VaR measure to market movements.
Confidence Level
The confidence level, often expressed in terms of percentage (e.g., 95% or 99%), represents the level of certainty associated with the VaR estimate. In the case of historical simulation, (which will be discussed ahead in the blog) a 95% confidence level implies that there is a 5% chance of the actual loss exceeding the calculated VaR. The higher the confidence level, the higher the VaR value and vice versa.
Volatility Estimation
Volatility is a measure of the degree of variation of a trading price series over time. It is a crucial input in VaR calculations, reflecting the inherent uncertainty and risk in financial markets. Common methods for estimating volatility include historical volatility (based on past price movements), implied volatility (derived from option prices), and various statistical models.
Return Distribution
The return distribution implies the statistical distribution of potential returns (of the portfolio or asset). The choice of return distribution, often assumed to be normal but may include alternatives like the Student’s t-distribution, affects the accuracy of VaR estimates. Non-normality in return distributions can be significant, especially during extreme market events.
These components collectively contribute to the quantification of VaR, providing a measure of the potential loss under specific conditions.
It’s important to note that while VaR is a widely used risk measure, it has limitations, particularly in capturing tail risk in extreme events. Some risk management frameworks may also incorporate additional measures, such as Expected Shortfall (ES), to address these limitations and provide a more comprehensive view of risk.
Value at Risk vs. Expected Shortfall
Before seeing the differences between Value at Risk and expected shortfall, let us briefly see what the expected shortfall is.
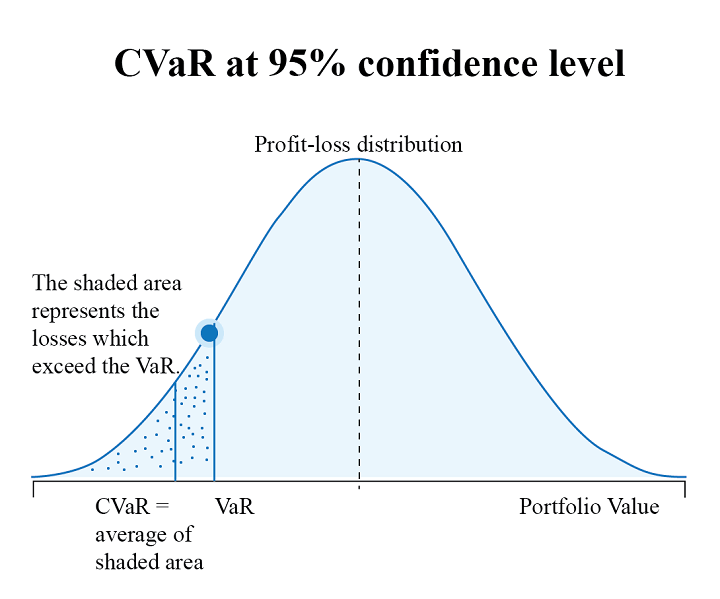
Conditional Value-at-Risk, also known as Expected Shortfall (ES), is a risk assessment measure that quantifies the amount of tail risk in an investment portfolio. It is computed by taking a weighted average between the VaR value and the losses exceeding VaR.
As you can see below, CVaR is seen as an extension of VaR and is considered superior to VaR as it accounts for losses exceeding VaR. Therefore, you can use CVaR in your portfolio optimisation strategy to get a better idea of extreme losses and effectively manage your portfolio risk.
Now, let us find out the key differences between Value at Risk and expected shortfall (ES).⁽²⁾
| Feature | Value at Risk (VaR) | Expected Shortfall (ES) |
| Definition | Quantifies the maximum potential loss at a given confidence level over a specific time horizon. | Measures the average loss beyond the VaR threshold. |
| Example | A 95% VaR of $1 million implies there is a 5% chance of losing more than $1 million over a specified time horizon. | An ES of $1 million at a 95% confidence level indicates that, in the worst-case scenario beyond the VaR threshold, the average loss would be $1 million. |
| Focus | Specific quantile at a confidence level, representing a threshold below which losses are not expected to exceed. | Captures the average loss in the tail of the distribution, specifically beyond the VaR level. |
| Interpretation | Represents a dollar amount or percentage at risk with a certain probability. | Represents the average amount of loss beyond the VaR level. |
| Sensitivity to Extreme Events | May underestimate the severity of extreme events as it focuses on a specific quantile. | Specifically addresses the severity of extreme events by considering the entire tail. |
| Shortcomings | Can be less informative about the severity of extreme events. | Requires more data and computational resources but offers a more comprehensive view. |
| Regulatory Perspective | Historically common in regulatory frameworks. | Some regulators advocate its use as a complementary measure to VaR. |
| Portfolio Management | Commonly used for risk limits and capital allocation. | Provides insights into risk for more conservative risk management strategies. |
Stay tuned for Part II to learn about Value at Risk applications in trading.
Originally posted on QuantInsti blog.
Disclosure: Interactive Brokers
Information posted on IBKR Campus that is provided by third-parties does NOT constitute a recommendation that you should contract for the services of that third party. Third-party participants who contribute to IBKR Campus are independent of Interactive Brokers and Interactive Brokers does not make any representations or warranties concerning the services offered, their past or future performance, or the accuracy of the information provided by the third party. Past performance is no guarantee of future results.
This material is from QuantInsti and is being posted with its permission. The views expressed in this material are solely those of the author and/or QuantInsti and Interactive Brokers is not endorsing or recommending any investment or trading discussed in the material. This material is not and should not be construed as an offer to buy or sell any security. It should not be construed as research or investment advice or a recommendation to buy, sell or hold any security or commodity. This material does not and is not intended to take into account the particular financial conditions, investment objectives or requirements of individual customers. Before acting on this material, you should consider whether it is suitable for your particular circumstances and, as necessary, seek professional advice.
Join The Conversation
If you have a general question, it may already be covered in our FAQs. If you have an account-specific question or concern, please reach out to Client Services.