


In a recent IBKR podcast, entitled “Might Correlation be the Key to Understanding VIX?”, my guest Mandy Xu, head of derivatives market intelligence at Cboe, contended that the recent dispersion in equity returns was a key factor to the low levels of volatility indices like VIX, the Cboe Volatility Index. I feel somewhat remiss in not having followed up our discussion with some hard data. Let’s rectify that today, and show that current levels of VIX might not be keeping up with changes in correlation.
During our discussion, Mandy noted:
…one thing to highlight is the role that correlation and dispersion kind of play in in into … the level of the VIX. Keep in mind that the VIX is a measure of S&P 500 index volatility. For the S&P 500 index (SPX), it’s a function of, obviously, not just the volatility of the individual stocks, but also the correlation of those stocks. And the way that I explain it is that you take it to the extreme and simplify it to an index of just two stocks equally weighted. If one stock goes up 20% in a day and another stock goes down 20% in a day, at the index level that’s unchanged. So, high stock volatility, but very low index volatility in an environment of extreme dispersion or low correlation. And that’s what we’ve seen this year. S&P 500 correlation went from levels ranging from 40 to 50 last year to a low of 8% earlier this year. And to put that in context, that’s pretty much at or near historic lows.
The Cboe has a suite of correlation indices designed to measure “correlation market expectations by quantifying the spread between the SPX index implied volatility and the average single-stock basket component implied volatility.” Among the various index choices, we prefer to use the one-month implied correlation term structure for at-the-money options, COR1M, because it uses S&P 500 (SPX) options with very similar times to expiration as VIX. The exchange defines it this way:
Implied Correlation, a gauge of herd behavior, is the market’s expectation of future diversification benefits. It measures the average expected correlation between the top 50 stocks in the SPX index. Cboe calculates COR3M [the 3-month counterpart to COR1M] by using ATM delta relative constant maturity SPX index and component option implied volatilities.
When we look at a long-term graph comparing VIX and COR1M, we see there is a relationship between the two:
10-Year Chart, COR1M (blue/white weekly bars) vs. VIX (red line)
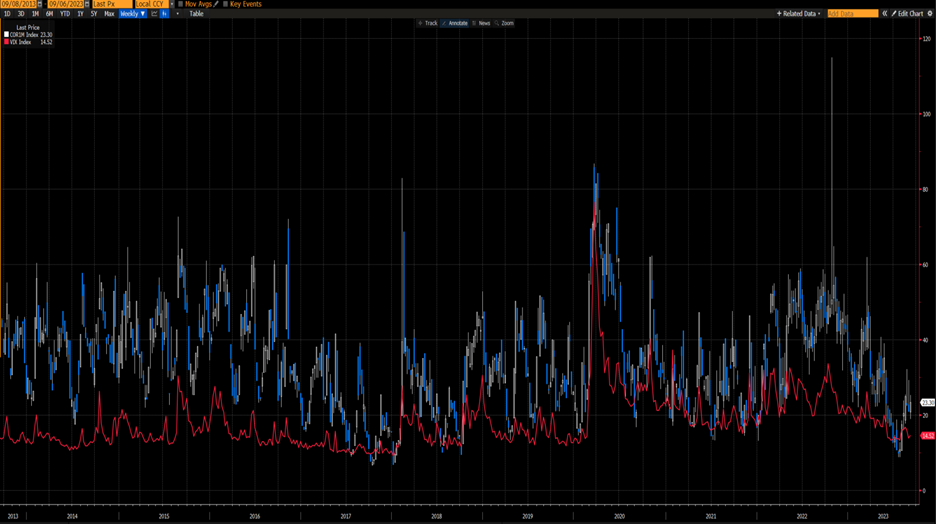
Source: Bloomberg
The relationship has continued over the past six month, though it appears that VIX has lagged behind lately:
6-Month Chart, COR1M (blue/white daily bars) vs. VIX (red line)
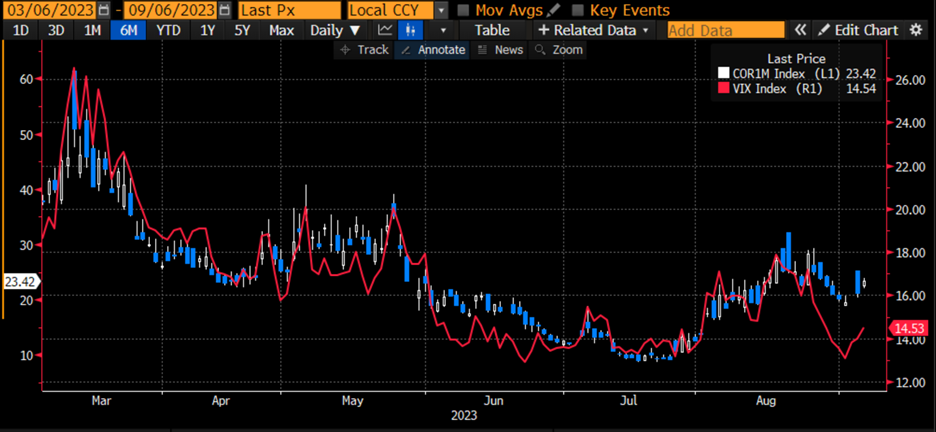
Source: Bloomberg
Lines on a chart that generally follow each other are nice, but we prefer more robust statistics if we are to assert that there is a tradeable relationship between the two. A quick statistical analysis shows that to be the case. While it does seem a bit reflexive to utilize a correlation between a volatility index and a correlation index, scatter plots show a stable relationship between COR1M and VIX. We set COR1M as the independent variable, since that fits with the initial assertion that we are attempting to test.
The charts and tables below show 5-year (top) and 1-year (bottom) scatterplots for the daily closing values of VIX vs. COR1M. The slopes of the best fit lines (BETA) are quite similar, and while there are some definite outlier points (on the upper graph they are mostly in March of 2020, on the lower they are in late-September and October of 2022), the vast majority of points are clustered around the trend lines.
Historical Regression Analyses Between COR1D (X-axes) and VIX (Y-axes)
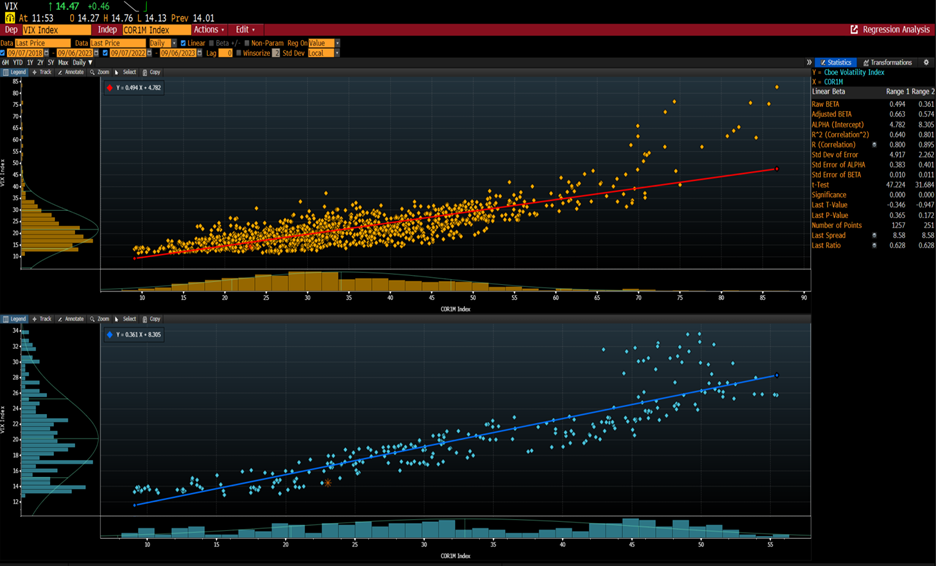
Source: Bloomberg
Most importantly, the R-squared correlations are relatively high, particularly over the past year. The 5-year R^2 is 0.640, while the 1-year comes in at .801. Both are high enough to assert a statistical relationship, the latter is high enough to consider that relationship to be tradeable.
On that basis, it should be noted that today’s dot on the one-year scatterplot is at a low level relative to the trend line. We have seen bigger divergences during that time period, but those occurred when VIX was in the high teens and low 20’s. Most of the dots with similar characteristics have occurred during the past two weeks. It is quite possible that VIX has simply not kept up with correlation over recent days, and could indicate a buying opportunity for volatility protection.
I offered my theory for why VIX has tended to be relatively low this year, which can also explain why we have not seen it rally significantly as broader indices have slipped:
I’ve … said… many times, “VIX is not a fear gauge. It just plays one on TV…”
… but when you get to turning points … VIX is the price of parachutes when a plane hits turbulence. This comes from my experience as a market maker. Nobody really wants umbrellas when it’s when there’s a drought, nobody really thinks about a parachute if the plane is moving along smoothly at 30,000 feet, but as soon as you hit some turbulence, or as soon as the rain clouds develop, people want them and they want them in a hurry. And to me, VIX is still the most efficient way for an institutional manager to hedge his or her risks. Just, “I want to de-risk quickly.” I think what explained a lot of what was going on in 2022 was that the initial down wave caught a lot of people by surprise. Everybody was on one side of the trade for the most part, and we started going down, and people needed to de-risk in a hurry. As the year went on. VIX declined because as people sort of got inside, they got more comfortable with the level of risk in their portfolio.
So far, it appears that portfolio managers remain relatively comfortable with the risks they are carrying into a seasonally tricky period. If the current downswing remains modest, then they might continue to forego the protection that VIX can offer. But if this downtrend persists or even accelerates, it seems reasonable to expect that investors will suddenly clamor for some insurance. If you believe that it is prudent to protect one’s portfolio ahead of some seasonal and economic challenges, it is far more prudent to do so now, while that protection is relatively inexpensive.
Join The Conversation
If you have a general question, it may already be covered in our FAQs. If you have an account-specific question or concern, please reach out to Client Services.
Leave a Reply
Disclosure: Interactive Brokers
The analysis in this material is provided for information only and is not and should not be construed as an offer to sell or the solicitation of an offer to buy any security. To the extent that this material discusses general market activity, industry or sector trends or other broad-based economic or political conditions, it should not be construed as research or investment advice. To the extent that it includes references to specific securities, commodities, currencies, or other instruments, those references do not constitute a recommendation by IBKR to buy, sell or hold such investments. This material does not and is not intended to take into account the particular financial conditions, investment objectives or requirements of individual customers. Before acting on this material, you should consider whether it is suitable for your particular circumstances and, as necessary, seek professional advice.
The views and opinions expressed herein are those of the author and do not necessarily reflect the views of Interactive Brokers, its affiliates, or its employees.


simple and elegant. thank you for the post.
Thank you for commenting, Anonymous.