


By: Ulrik Simmelholt, Steno Research
EXECUTIVE SUMMARY
- Main take aways: Long utilities in Europe. OPEC looks like losing control with the market. SPR purchases could floor Oil markets here.
- Last week wasn’t the best in terms of our trades in the energy space after an otherwise strong year in our tactical bets placed within the sector.
- We have been stopped out of our natural gas trade and our crude oil long is now in the red.
Main take aways:
- Long utilities in Europe
- OPEC looks like losing control with the market
- SPR purchases could floor Oil markets here
Happy Monday from Copenhagen everyone. Last week wasn’t the best in terms of our trades in the energy space after an otherwise strong year in our tactical bets placed within the sector.
We have been stopped out of our natural gas trade and our crude oil long is now in the red. Not a pretty week to say the least as disinflationary/recessionary sentiments take control. We still like natural gas in Europe but we are keen on moving away from the volatility of being outright long TTF hence Utilities are an interesting bet given their ability to pass on prices. A long low beta equity position will also work well in a portfolio where rate cuts are being priced in but haven’t spilled over to equity space.
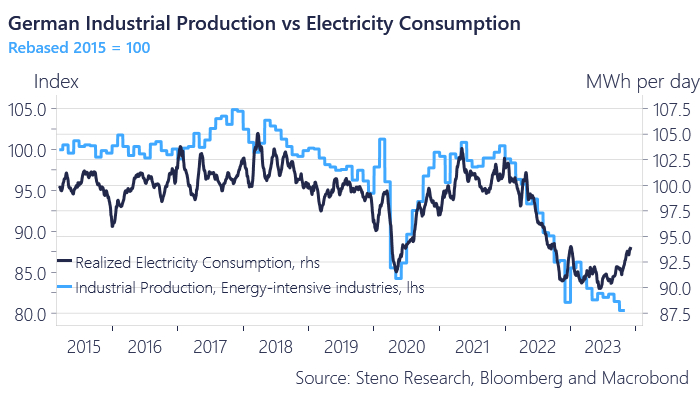
Let’s start with the reasoning behind utilities seeing higher prices. We sent our gratitude to Olaf Scholz last week given that the German coalition reached a deal on the 2024 budget. Scholz spoke at a party congress last week, promising that the deal will go through and we feel certain that giving a much needed life line to Germany’s ailing industry will see electricity consumption rise.
Chart 1: Scholz helping hand to the energy intensive industry
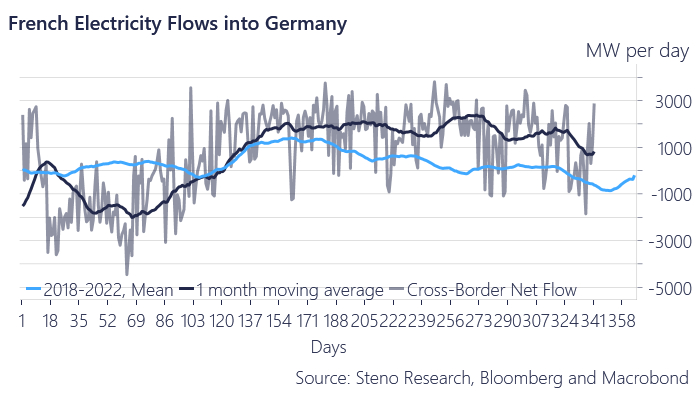
With the subsidy set in place we’ll look around to see who’ll gain from this. French electricity flows into Germany are settling at a structurally higher level than its ’18-’22 mean levels before Germany shut down their nuclear power plants. Now that the German government wants to help their shaky power intensive industry by subsidizing them, this increase in demand should be profitable for French energy utilities given supply inelasticities. Historically French nuclear production has always been the strongest in the colder months of the year, but rising electricity prices in the Northern part of Europe over the past month or two emphasizes the need for stable deliveries.
Chart 2: France to become a permanent net exporter of electricity to Germany?
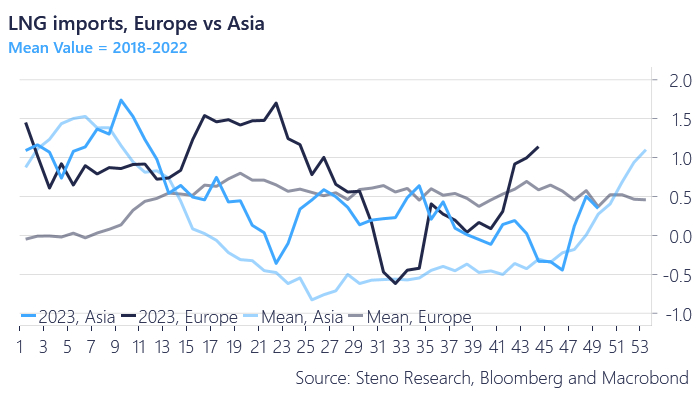
Going back to natural gas markets we also like the upside coming from the demand side in Asian buyers who up until this point have been largely muted, which has contributed to the falling prices over the last months. Japan’s natural gas stock levels are, as opposed to European and North American, much lower and a cold snap could easily see demand being brought into the market.
Historically, data would also suggest that Asian buying will increase going into the new year and peaking around March.
Chart 3: Asian vs European LNG imports
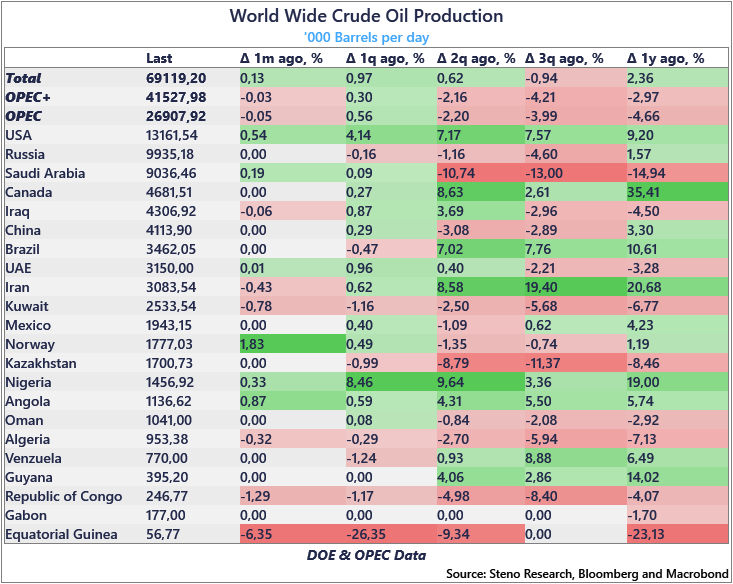
Moving over to crude oil where OPEC’s cuts just cannot give any support to the market as prices have been one way traffic for the entire month. At this point it feels like OPEC has lost control of the market and the shorts have smelled blood in the water. The production cuts have diminishing returns and the total supply side of crude is up 2.36% y/y in large parts thanks to the US.
We have a very hard time seeing MBS flooding the market to flush out US production especially given that the short term pain will likely lead to so much internal friction that there would be no more OPEC post market flooding. Just think of Russia’s reliance on crude oil income to finance its war efforts in Ukraine. MBS’ best bet is likely still a Riyahd Accord with Biden or an internal transfer union.
Chart 4.a: Cutting to increase price is short sighted
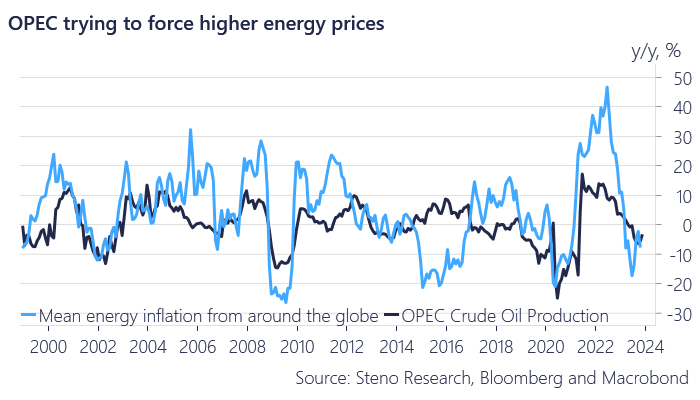
Chart 4.b: Supply increasing globally
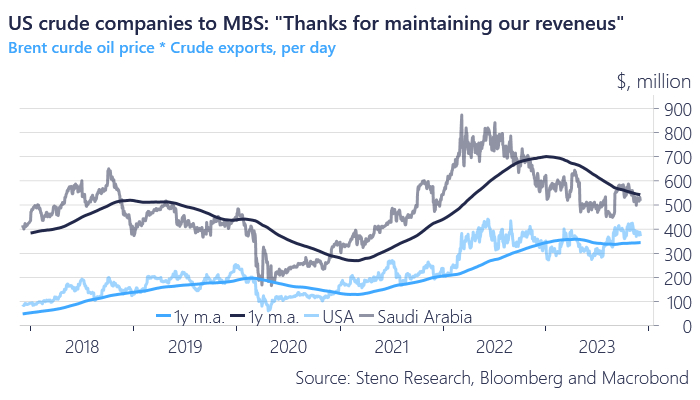
The US has been producing more than the Saudis for quite some time now, but in terms of exports that has not been the case. Recent production decreases by the Saudis have led to export numbers converging and in terms of income the OPEC production cuts have allowed the Americans to steadily get around USD 350 million a day in export income at the expense of Saudi Arabian export income. This transfer of income has been a contributing reason for the US being the cleanest of the dirty shirts in terms of economic outlook.
With the internal interests in OPEC, which do not align with overall interests and a booming US shale export, is this the beginning of the end of OPEC? Time will tell, but it is clear that they are in a weak position as a group.
Chart 5: MBS allowing the US to maintain around USD 350m in export income per day in 2023
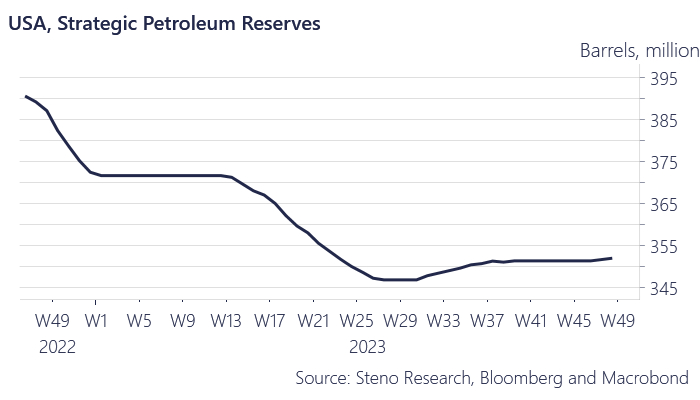
Over the last months the US has even taken the opportunity to exploit the lower prices in crude to fill up their SPR. The DoE has publicly stated that they will be buyers at these levels and only limited by the physical constraints of the caverns (Someone has forgotten about Yellen apparently).
We are talking some 3 million barrels a month of buying which means we still have a long way to go before getting to the levels around 650 million barrels which were in stock before Biden became crude oil trader of year 2022.
The SPR purchases could help floor oil prices here and we remain moderately upbeat on a price jump here, but long gone are the (Saudi Arabian) hopes of >100$s a barrel.
Chart 6: SPR buying back but not in size
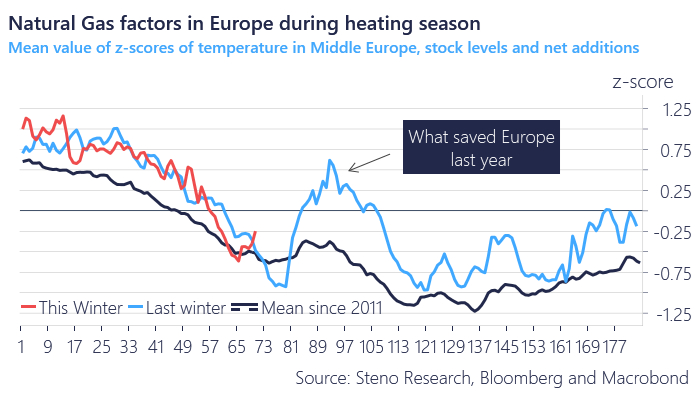
Our three factor natural gas model bounced drastically over the last week due to temperatures and stock levels. We are now above the values from last winter. The US east-coast moreover saw average temperatures around 16 fahrenheit higher than seasonally usual over the weekend, which means that mother nature simply did not play ball with otherwise bullish Nat Gas fundamentals this time around.
The foundation for a strong Nat Gas rebound remains in place for 2024, but it is tricky to stomach the short-term volatility unless we really get a cold snap again soon. Utilizing option spreads may be a way to keep the bullish “lottery ticket” alive.
Chart 7: Our three factor Nat Gas model turned around swiftly
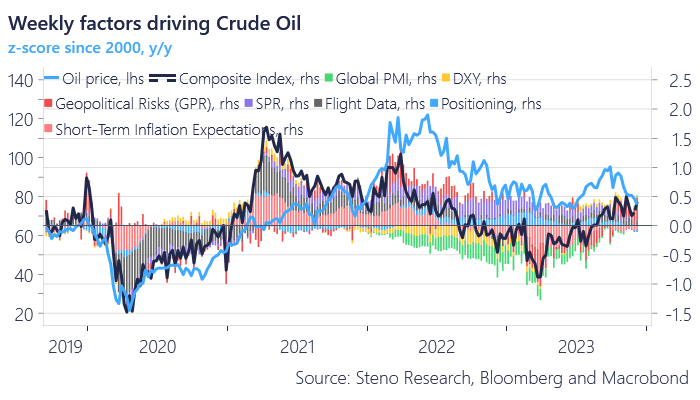
Our crude oil model has jumped in r-squared and suggest prices should be higher. We remain long oil but with lukewarm conviction and have added Utilities in equity space to profit from rising electricity prices paired with a softer interest rate environment.
Chart 8: Our factors model for oil
—
Originally Posted December 11, 2023 – Energy Cable #49: Ouch …..
Disclosure: Smartkarma
Smartkarma posts and insights are provided for informational purposes only and shall not be construed as or relied upon in any circumstances as professional, targeted financial or investment advice or be considered to form part of any offer for sale, subscription, solicitation or invitation to buy or subscribe for any securities or financial products. Views expressed in third-party articles are those of the authors and do not necessarily represent the views or opinion of Smartkarma.
Disclosure: Interactive Brokers
Information posted on IBKR Campus that is provided by third-parties does NOT constitute a recommendation that you should contract for the services of that third party. Third-party participants who contribute to IBKR Campus are independent of Interactive Brokers and Interactive Brokers does not make any representations or warranties concerning the services offered, their past or future performance, or the accuracy of the information provided by the third party. Past performance is no guarantee of future results.
This material is from Smartkarma and is being posted with its permission. The views expressed in this material are solely those of the author and/or Smartkarma and Interactive Brokers is not endorsing or recommending any investment or trading discussed in the material. This material is not and should not be construed as an offer to buy or sell any security. It should not be construed as research or investment advice or a recommendation to buy, sell or hold any security or commodity. This material does not and is not intended to take into account the particular financial conditions, investment objectives or requirements of individual customers. Before acting on this material, you should consider whether it is suitable for your particular circumstances and, as necessary, seek professional advice.
Disclosure: Futures Trading
Futures are not suitable for all investors. The amount you may lose may be greater than your initial investment. Before trading futures, please read the CFTC Risk Disclosure. A copy and additional information are available at ibkr.com.


Join The Conversation
If you have a general question, it may already be covered in our FAQs. If you have an account-specific question or concern, please reach out to Client Services.