


By K.T. Arasu and Arthur Yu
The El Niño weather pattern that could herald a warmer-than-normal winter in North America is gaining in intensity, with sea surface temperatures in the equatorial Pacific Ocean rising 1.5 degrees Centigrade above normal levels through the August-October three-monthly tracking period this year (Figure 1).
Figure 1: El Niño returns after four years, could herald a warmer-than-normal winter
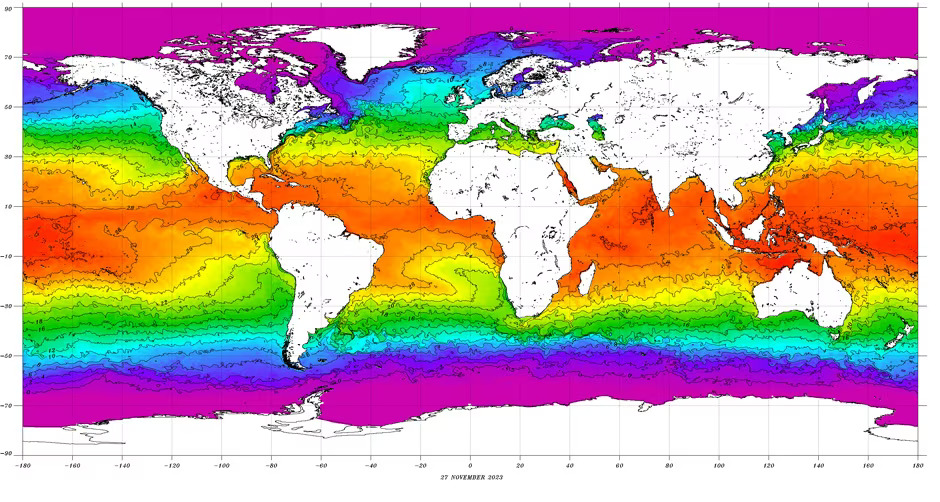
Source: National Oceanic and Atmospheric Administration (NOAA)
The strongest El Niño was recorded in 2015/16 when sea surface temperatures in the central and east-central Pacific Ocean rose 2.6 degrees above normal, putting pressure on natural gas and electricity prices in the United States as demand for space heating in homes and offices declined. This year’s El Niño has been categorized as “strong,” with temperatures having risen by 1.5 degrees above normal. When the scale exceeds two degrees, the classification changes to “very strong.”
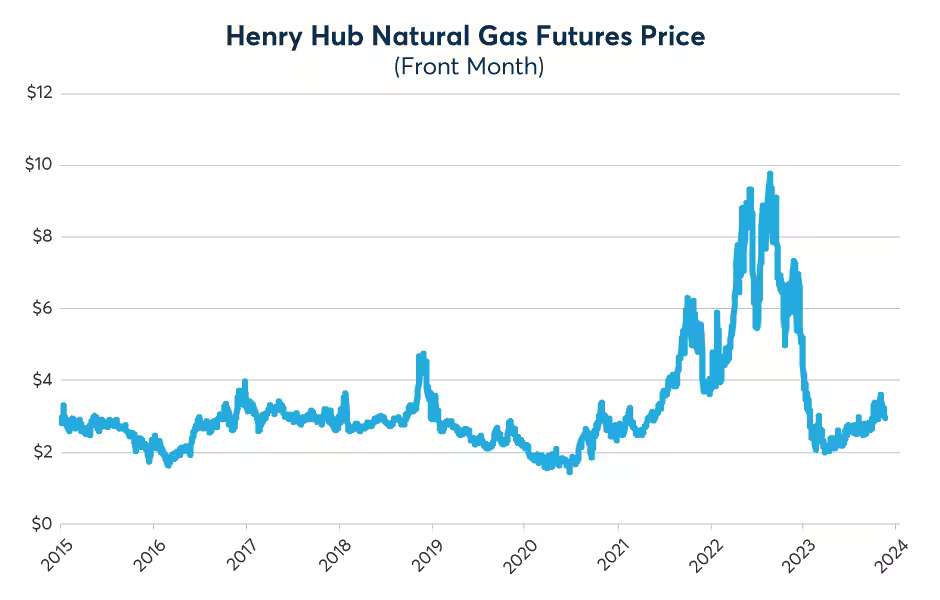
So, how might El Niño impact the markets this time around? For starters, natural gas prices in the U.S. are down about 70% from their highs of August 2022. That’s in line with market moves during the El Niño of 2015/16 when prices of natural gas tumbled by 72% from February 2014 to February 2016. The market bottomed out in March 2016 and began a five-year climb that peaked in August 2022 – a rise of 236% from the lows in 2020. This rally coincided with a La Niña, which brings cooler-than-normal temperatures, that took hold for most of 2021 and 2022 (Figure 2).
Figure 2: Natural gas futures tend to respond to El Niño and La Niña weather patterns
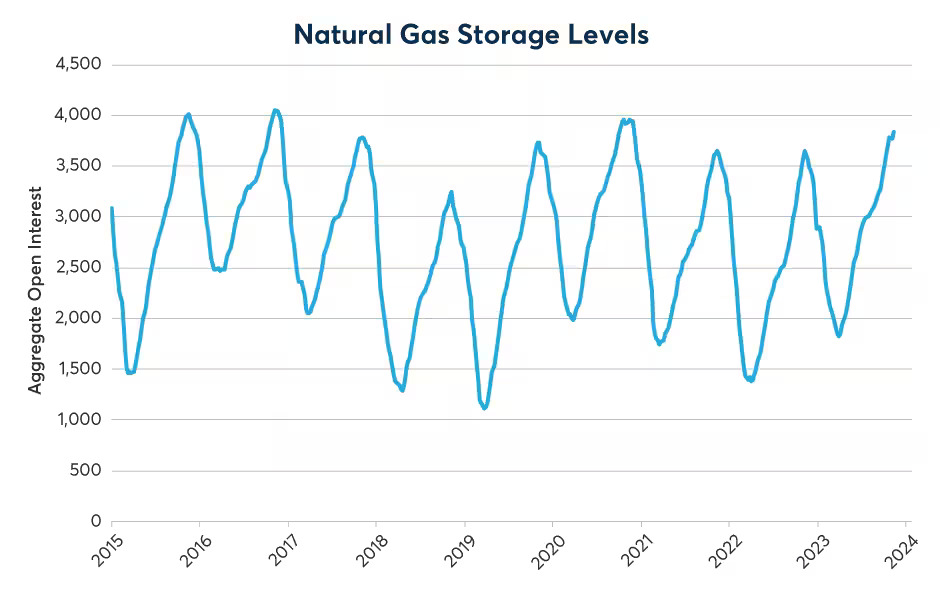
While the declines in natural gas prices this year could be attributed to the La Niña effect, there is another significant factor at play: stockpiles. Natural gas in storage in the Lower 48 states is running at 3.8 billion cubic feet (bcf) as of November 2023, about 5% higher than levels a year ago, and 5.2% higher than the five-year average. The Energy Department forecast in November for inventories to be even higher during the winter heating season from November to March at 21% above the five-year average (Figure 3).
Figure 3: High storage levels of natural gas are also a factor in the price slump
The combination of high stockpiles and expectations for unseasonably warm weather in the northern United States during the winter months could put additional pressure on the natural gas market in the coming months.
There are also other factors for investors in the natural gas market to focus on:
- Production: U.S. natural gas production is expected by the Energy Department to hit a record high of 103.72 billion cubic feet daily (bcfd) this year and 105.13 bcfd in 2024. That compares with 99.60 bcfd in 2022. So, ample supply could keep a lid on the market, all else being equal.
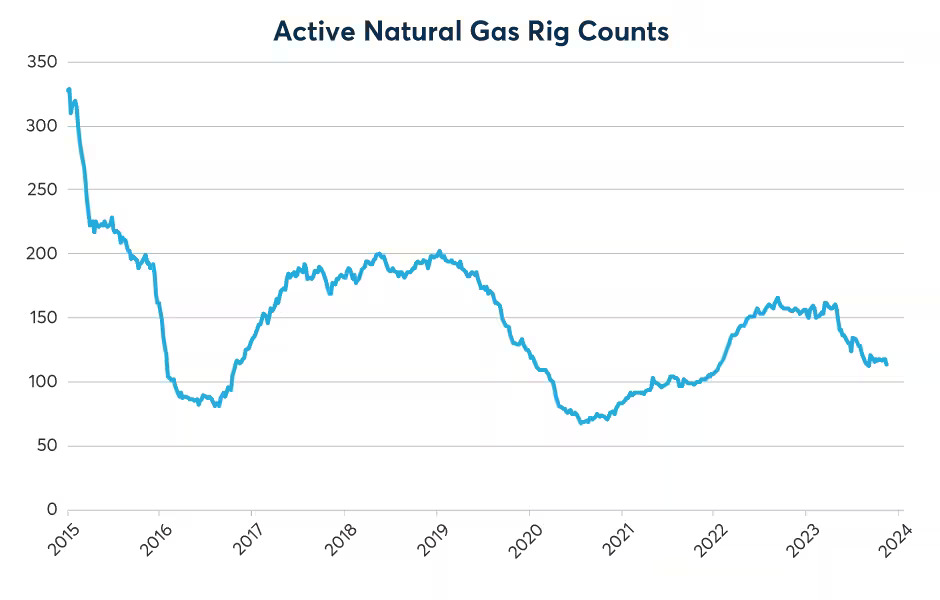
- Investment: Rig counts for natural gas have tumbled from a high of 161 in April 2023 to 118 by early November (Figure 4). This could lead to little meaningful new exploration taking place in the short term, but rigs have become more efficient, helping to bolster production even when their numbers are down.
Figure 4: There has been a sharp decline in the rig count, but output continues to rise
- Exports: Natural gas shipments in the first half of this year exceeded those for the whole of last year. Exports took off in a big way in 2016 when the Chenière Sabine Pass became operational. Exports soared 1.51 trillion cubic feet (tcf) from 2014 to 6.9 tcf in 2022. This could help underpin prices.
- Demand: Natural gas consumption by both residential and commercial users will likely be lower this year compared to 2022 due to the expected warmer-than-normal weather conditions in the northern U.S. If the El Niño is followed by a La Niña like in 2016, it could spark a rally in natural gas prices.
- Alternatives: Large amounts of alternative energy production capacity are also coming on line, but with alternatives there are two things to remember: First, capacity isn’t the same thing as generation. Solar panels and wind turbines generate nothing when the sun isn’t shining or the wind isn’t blowing, respectively. On average, they run at about one quarter capacity whereas natural gas generation comes close to operating at full capacity. Secondly, investment in the solar and wind sectors depends heavily on tax subsidies, and the future of such tax subsidies depends on political outcomes in Washington that are difficult to forecast. Coal, meanwhile, is natural gas’s main competitor and is in terminal decline.
El Niño and the Midwest Grain Belt
The El Niño is arriving at a time when low water levels are already posing challenges to transporting grain on the Mississippi River, a key artery for the shipment of a variety of commodities including oil from production centers in the Midwest and elsewhere to export points along the Gulf Coast.
Warmer-than-normal in the northern United States coupled with reduced rainfall could aggravate the situation on the Mississippi River and impact movement of commodities along the primary waterway. But transportation during the winter months does come to a crawl as parts of the river, especially along the upper reaches of the Midwest are closed due to ice formation. The Panama canal, another important waterway that connects the Pacific and Atlantic oceans and is crucial to maritime trade is already restricting the number of vessels passing through it due to low water levels. The Baltic Dry Index, typically a measure of freight used to transport dry bulk cargoes like grains, fell 34% between mid-October and early November before recovering half the losses.
As for crops in the U.S. Midwest, the corn and soybean crops are largely harvested by November, with planting of new crops beginning in March. The hard and soft red winter wheat crops are harvested by the summer, with new crop plantings beginning in the spring of 2024.
While the fields lie fallow in the winter months, the amount of rain and snowfall in the Midwest through this period is important in adding to sub-soil moisture. The U.S. Department of Agriculture said in a report in November that 40% of the area growing corn is affected by drought, 42% for soybean and 44% of winter wheat. It said 48% of the rice area is affected by drought.
While an El Niño could exacerbate drought conditions in the Midwest, does the weather phenomenon impact the price of grains? For the answer, we look to the 2015/16 El Niño, which began in 2015 with temperatures 0.5 degrees above normal. By the middle of the year, temperatures had reached 1.5-1.9 degrees above normal, peaking at 2.6 degrees above normal at the end of the year. The La Niña continued for the first five month of 2016 before fading away.
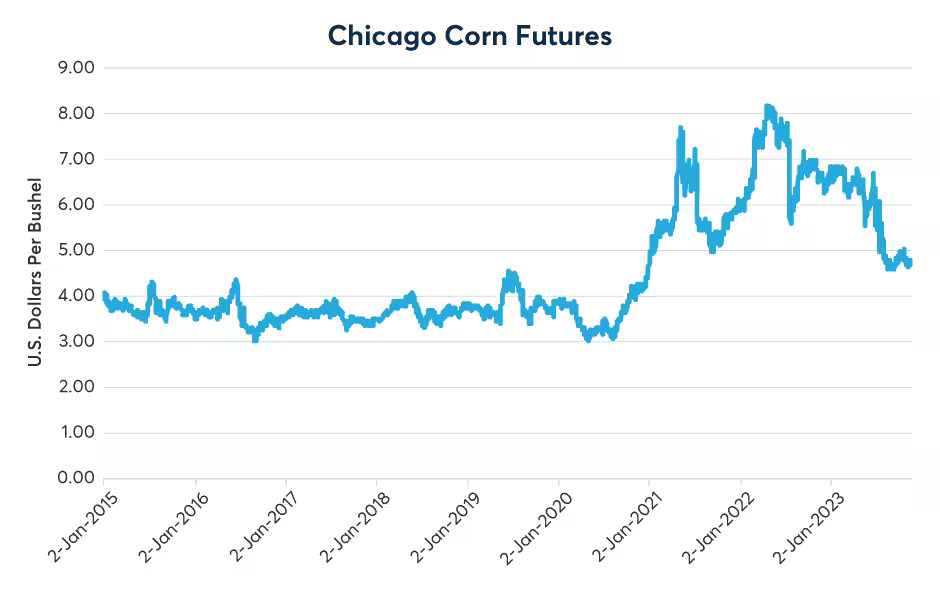
Chicago corn futures began 2015 at $3.98 per bushel (when temperatures were 0.5 degrees above normal), fell to $3.55 by mid-year (when temperatures were 1.5-1.9 degrees above normal), climbing slightly to $3.60 by the end of 2015 (when temperatures were peaking at 2.6 degrees above normal). By March 28, 2016, corn prices were at $3.56, beginning a rally that would take prices to $4.38 by June that year (when the El Niño had faded away and four months before the start of La Niña) (Figure 5).
Figure 5: Could El Niño stretch into the corn planting season next spring?
On balance, increased exports could support a rise in natural gas prices, but rising production and an expected drop in winter demand could negate any such argument to the upside – unless a La Niña follows on the heels of the El Niño like it did in 2016. However, before any bull market begins to take shape, there needs to be a substantial drawdown of storage levels. In the meantime, in addition to watching the traditional economic drivers of natural gas, don’t forget to visit the National Oceanic and Atmospheric Administration’s (NOAA) website https://www.noaa.gov/ and check out sea surface temperatures. As much as any other factor, the agency holds the key to understanding the intermediate-term evolution of natural gas prices.
—
Originally Posted November 30, 2023 – As El Niño Intensifies, Natural Gas Takes a Tumble
Disclosure: Interactive Brokers
Information posted on IBKR Campus that is provided by third-parties does NOT constitute a recommendation that you should contract for the services of that third party. Third-party participants who contribute to IBKR Campus are independent of Interactive Brokers and Interactive Brokers does not make any representations or warranties concerning the services offered, their past or future performance, or the accuracy of the information provided by the third party. Past performance is no guarantee of future results.
This material is from CME Group and is being posted with its permission. The views expressed in this material are solely those of the author and/or CME Group and Interactive Brokers is not endorsing or recommending any investment or trading discussed in the material. This material is not and should not be construed as an offer to buy or sell any security. It should not be construed as research or investment advice or a recommendation to buy, sell or hold any security or commodity. This material does not and is not intended to take into account the particular financial conditions, investment objectives or requirements of individual customers. Before acting on this material, you should consider whether it is suitable for your particular circumstances and, as necessary, seek professional advice.
Disclosure: Futures Trading
Futures are not suitable for all investors. The amount you may lose may be greater than your initial investment. Before trading futures, please read the CFTC Risk Disclosure. A copy and additional information are available at ibkr.com.


Join The Conversation
If you have a general question, it may already be covered in our FAQs. If you have an account-specific question or concern, please reach out to Client Services.