

")


Volatility in the crude oil and natural gas markets has been a big topic among investors and policy makers recently. Limited supplies and higher demand are pushing prices higher, and stock prices in the Energy sector are responding.
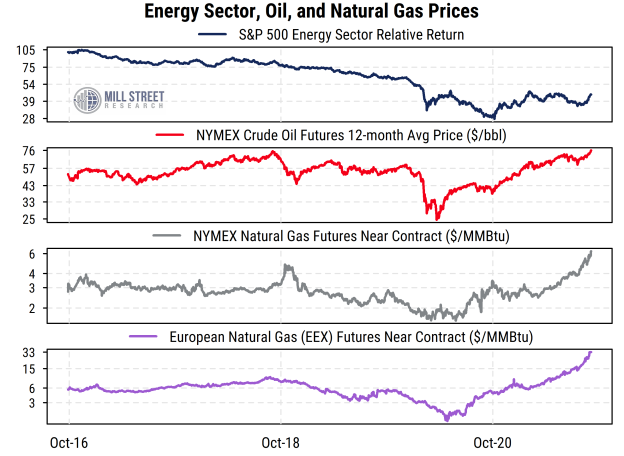
The chart below helps put recent movements in perspective, seen in the context of the last five years. Crude oil prices (second section, in red) have just recently topped their 2018 peak, completing a full recovery from the COVID-related drop and weakness that preceded COVID. But the five-year average for crude oil has been about $55/bbl, with a low of $25 (on this measure, which uses an average of the next 12 months of crude oil futures contracts to avoid near-contract distortions) and a current high of $76. So crude is elevated but not at an extraordinary level given it was at about the same price in October 2018. And it reached much higher levels above $100/bbl. back in 2008, 2011, and 2012.
Source: Mill Street Research, Bloomberg, Factset
US natural gas prices (third section, in grey) have been more dramatic recently, jumping to about $6/MMBtu, about double the five-year average of just under $3/MMBtu. It is also well above the late 2018 peak, and at a similar level to a spike that occurred in the winter of 2014.
But if US natural gas prices look worrisome, the movements of natural gas in Europe make US prices appear downright dull by comparison. Natural gas futures in Europe (bottom section, in purple) have skyrocketed to the equivalent of over $30/MMBtu (gas futures are priced in euros per megawatt-hour in Europe so we have converted the prices to the US standard of millions of BTUs and converted the euro price to US dollars for comparison). The five-year average price in Europe before the latest surge was slightly below $6/MMBtu (gas is typically more expensive in Europe due to more limited local supplies). So current prices are about five times the normal price in Europe. Natural gas is costly to liquefy and ship overseas, so there is only modest scope to arbitrage the price differences between the US and Europe.
The top section of the chart shows the relative performance of US S&P 500 Energy sector stocks relative to the S&P 500 index. Energy stocks outperformed from November through March in the initial move driven by the announcement of the Pfizer vaccine. They then showed mixed performance and lagged somewhat until mid-September when oil and gas prices started jumping and they have outperformed sharply. But over the longer five-year time frame, Energy stocks’ relative performance is still far below its levels from even 2019, and even more so from 2016.
What are some of the drivers of the jump in oil and gas prices? The situation is naturally complex, and global, but a few key elements are:
- Supplies of crude oil and natural gas have been impacted by weather, especially damage caused by Hurricane Ida in the Gulf of Mexico in late August.
- Renewable energy sources like wind or hydropower have had reduced output in some regions due to weather fluctuations or low water levels. This has led to increased demand for fossil fuel-based energy production.
- Geopolitical disputes between Europe and Russia have led to reduced supplies of Russian gas to Europe even as demand is up, a key factor in the huge surge in European natural gas prices. This has made oil a cheaper energy source by comparison, leading to higher demand for oil as well. Just this week, however, there are signs that Russia will increase gas deliveries to Europe to address the shortages.
- OPEC+ has opted to limit output growth and keep crude oil prices high. They recently met and did not increase their previously agreed quotas even though prices have jumped. The US shale producers, which acted as a counterbalance to OPEC in recent years, shut down a lot of production during COVID and have yet to resume previous production levels to offset OPEC’s influence.
While weather always makes both supply and demand for energy commodities unpredictable, policy makers have a great deal of influence on these markets, including those of OPEC, Russia, Europe, the US, and China. Analysts who follow energy companies must take these factors into account, as well as considerations such as how much each company hedges its oil and gas production (agreeing to sell their future output at a fixed price, using forwards and futures markets). So what can our bottom-up analyst estimate revisions indicators tell us about the oil and gas industry?
Not surprisingly, the US Oil Gas & Consumable Fuels industry has seen a sudden improvement in its relative earnings estimate revision metrics, as shown below. Such readings have historically been volatile, consistent with the volatility of the underlying commodities.
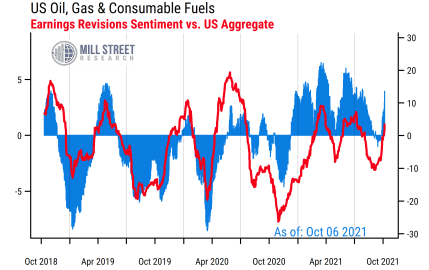
Source: Mill Street Research, Factset
We keep in mind, however, that the energy market is quite global, and so we can also check on the same revisions metrics for the broader global oil and gas industry relative to the world average. It shows stronger relative readings than those in the US, suggesting that there may be more leverage to higher commodity prices in oil and gas companies outside the US than in the US.
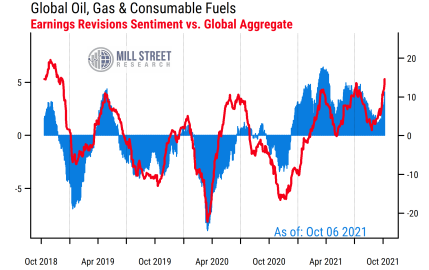
Source: Mill Street Research, Factset
The arguments for further upside for oil and gas include the extent that a weakening of the spread of COVID-19 allows more travel and thus fuel demand, and volatile weather keeps provoking demand and periodically limiting supplies, along with occasional geopolitical influences. A bear on energy might argue that oil producers in OPEC and major oil companies will not be able to resist increasing production significantly, pushing prices back down, and that the longer-term trends of movements to reduce fossil fuel use will continue to act as a drag on demand.
—
Originally Posted on October 7, 2021 – Big Moves in Energy Markets
Disclosure: Mill Street Research
Source for data and statistics: Mill Street Research, FactSet, Bloomberg
This report is not intended to provide investment advice. This report does not constitute an offer or solicitation to buy or sell any securities discussed herein in any jurisdiction where such offer or solicitation would be prohibited. Past performance is not a guarantee of future results, and no representation or warranty, express or implied, is made regarding future performance of any security mentioned in this report.
All information, opinions and statistical data contained in this report were obtained or derived from public sources believed to be reliable, but Mill Street does not represent that any such information, opinion or statistical data is accurate or complete. All estimates, opinions and recommendations expressed herein constitute judgments as of the date of this report and are subject to change without notice.
Disclosure: Interactive Brokers
Information posted on IBKR Campus that is provided by third-parties does NOT constitute a recommendation that you should contract for the services of that third party. Third-party participants who contribute to IBKR Campus are independent of Interactive Brokers and Interactive Brokers does not make any representations or warranties concerning the services offered, their past or future performance, or the accuracy of the information provided by the third party. Past performance is no guarantee of future results.
This material is from Mill Street Research and is being posted with its permission. The views expressed in this material are solely those of the author and/or Mill Street Research and Interactive Brokers is not endorsing or recommending any investment or trading discussed in the material. This material is not and should not be construed as an offer to buy or sell any security. It should not be construed as research or investment advice or a recommendation to buy, sell or hold any security or commodity. This material does not and is not intended to take into account the particular financial conditions, investment objectives or requirements of individual customers. Before acting on this material, you should consider whether it is suitable for your particular circumstances and, as necessary, seek professional advice.
Disclosure: Forex
There is a substantial risk of loss in foreign exchange trading. The settlement date of foreign exchange trades can vary due to time zone differences and bank holidays. When trading across foreign exchange markets, this may necessitate borrowing funds to settle foreign exchange trades. The interest rate on borrowed funds must be considered when computing the cost of trades across multiple markets.
Disclosure: Futures Trading
Futures are not suitable for all investors. The amount you may lose may be greater than your initial investment. Before trading futures, please read the CFTC Risk Disclosure. A copy and additional information are available at ibkr.com.


