


By: Maxwell Gold, CFA, George Milling-Stanley, Diego Andrade, Robin Tsui, CPA, CAIA, CA
- Gold’s prospects in the second half of 2023 remain bright, driven by a shift in monetary policy, the potential for recession, and growing potential for market shocks and volatility.
- Fundamental demand for gold remains robust led by central bank purchases.
- Despite nearing its all-time high price in US$, gold may have more room to run as investors shift back into the metal.
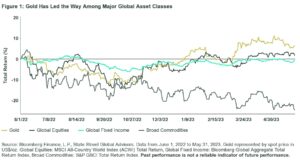
Heading into 2023, gold’s prospects looked positive despite muted performance in 2022 and a similar consensus sentiment among market participants. And gold has certainly shone brightly on an absolute and relative basis thus far in 2023: Year to date, gold posted a 7.61% return compared to 7.68% for global equities and 3.03% for global fixed income.1 Over the last 12 months, gold has outperformed both global equities and global fixed income broad indices. Gold also separated itself from the broader commodities universe which, amid moderating inflation and slowing demand, has seen a drop of -11.42% and -24.78% on a year-to-date and trailing 12-month basis, respectively.2
In our 2023 Gold Outlook, we outlined two key factors as important drivers for gold this year: interest rates and recession. Both factors will continue to impact gold throughout the rest of the year. But the regional banking crisis, the US debt ceiling, and on-going geopolitical turmoil globally have put risk front and center as another catalyst, on par with rates and recession, to continue to support the case for gold for the remainder of this year.
Gold and the Three Rs – Rates, Recession, and Risk
1. Rates: A Shift From Hike to Halt May Benefit Gold
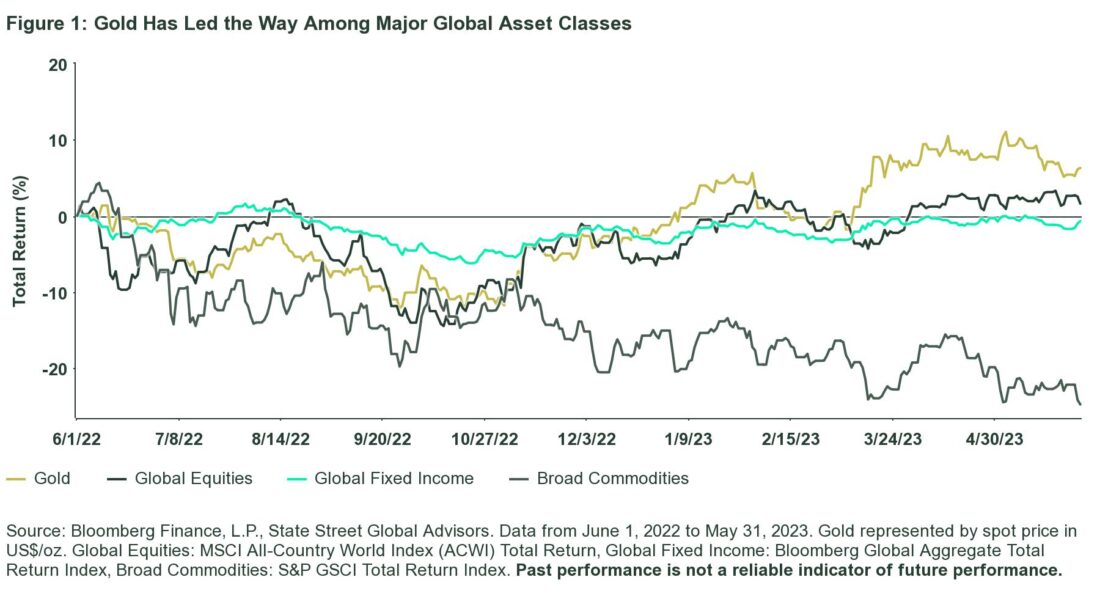
The Federal Reserve (Fed) began its current rate tightening cycle, the most aggressive hiking cycle on record, in March 2022. As the Fed ratcheted up its policy benchmark rates, gold began a sell-off that was exacerbated by four consecutive jumbo hikes of 75 basis points (bps) throughout 2022. But as inflation began to moderate, the Fed slowed the size of its rate hikes in Q4 2022. Gold subsequently bottomed out at US$1622/oz on September 26, 2022, shifted gears, and has since rallied 21%.3
This shift from expected rate hikes to an expected rate halt significantly benefitted gold. The first leg of the current gold rally was driven by expectations of an end to the Fed’s rate tightening cycle. The next leg of the current gold rally likely will come with the rate cut cycle over the near to medium term, pushing real yields lower as inflation remains elevated and sticky. This results in more limited downside for gold as the Fed rate cycle hits pause, expected by the end of this year.
The outlook for the US dollar has softened year to date, following a 20-year high last year. With expectations for slowing US growth and a ceiling for US real interest rates, the dollar may see further headwinds, particularly on a relative basis, with capital flowing to other regions, such as Europe, which continue to increase interest rates.
2. Recession: Slowing Growth May Spur Demand for Defensive Assets
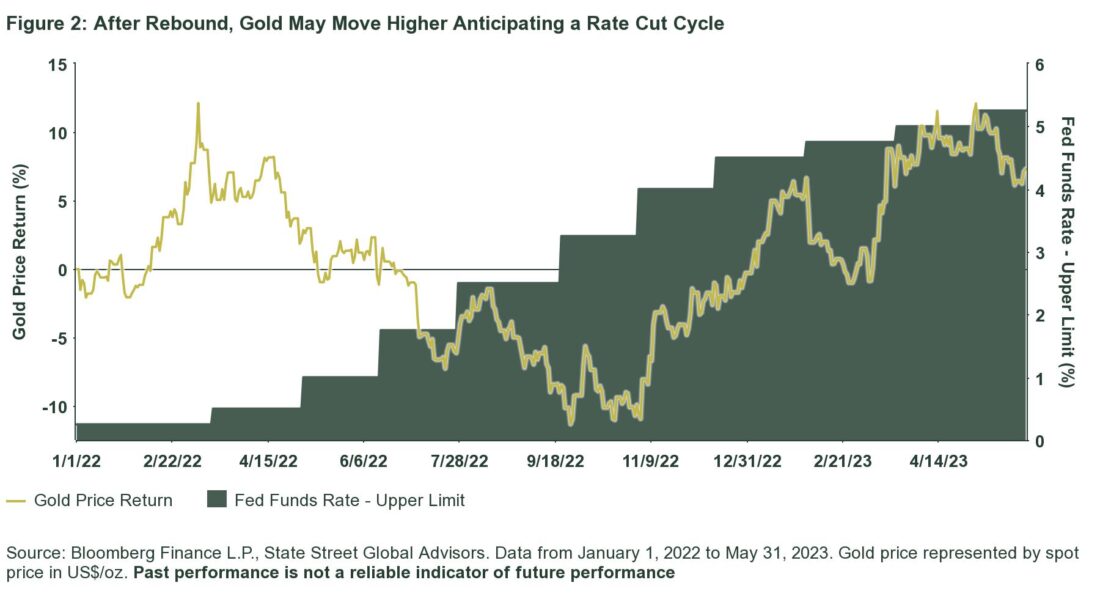
With expectations high not only for a US recession but also a global slowdown, gold may shine. It performed well during the seven US recessions since 1973, with an average return of 20.19% (see Figure 3). As such, gold may benefit from anticipation of a US recession, particularly compared to other asset classes.
Current leading economic indicators are nearing levels experienced during previous recessions with global and US growth trends signaling a slowdown amid sticky inflation. Whether the US economy is heading toward or already in a recession is up for interpretation. But it’s important to highlight that, historically, gold not only performs well during economic contractions but also in the periods immediately leading into a recession.
In the six months preceding a US recession, gold has been a clear favorite. During the last seven US recessions, gold averaged 11.32% in the immediate lead up to an economic recession. This makes intuitive sense as investors seek to build defensive positioning ahead of an anticipated growth slowdown.
As for the six months following a US recession, gold averaged 0.51%. Yet underperforming relative to other asset classes should not overshadow gold’s overall risk management characteristics and diversification benefit to portfolios — particularly during economic recovery periods that may still exhibit heightened volatility and persistent uncertainty.
You can read more about gold and the protection it may provide against recessionary risks in our Midyear ETF Market Outlook, Diversify Recession Risks with Cyclicals and Defensives.
3. Risk: Growing List of Tail Risks Could Help Gold Shine
Market risks are always a focus for gold investors, and 2023 has had no shortage of events to keep investors on their toes. With ongoing uncertainty on the global geopolitical front and recent risk events — including the regional banking crisis and US debt-ceiling debate — driving market volatility, the potential for further unforeseen risk events remains elevated.
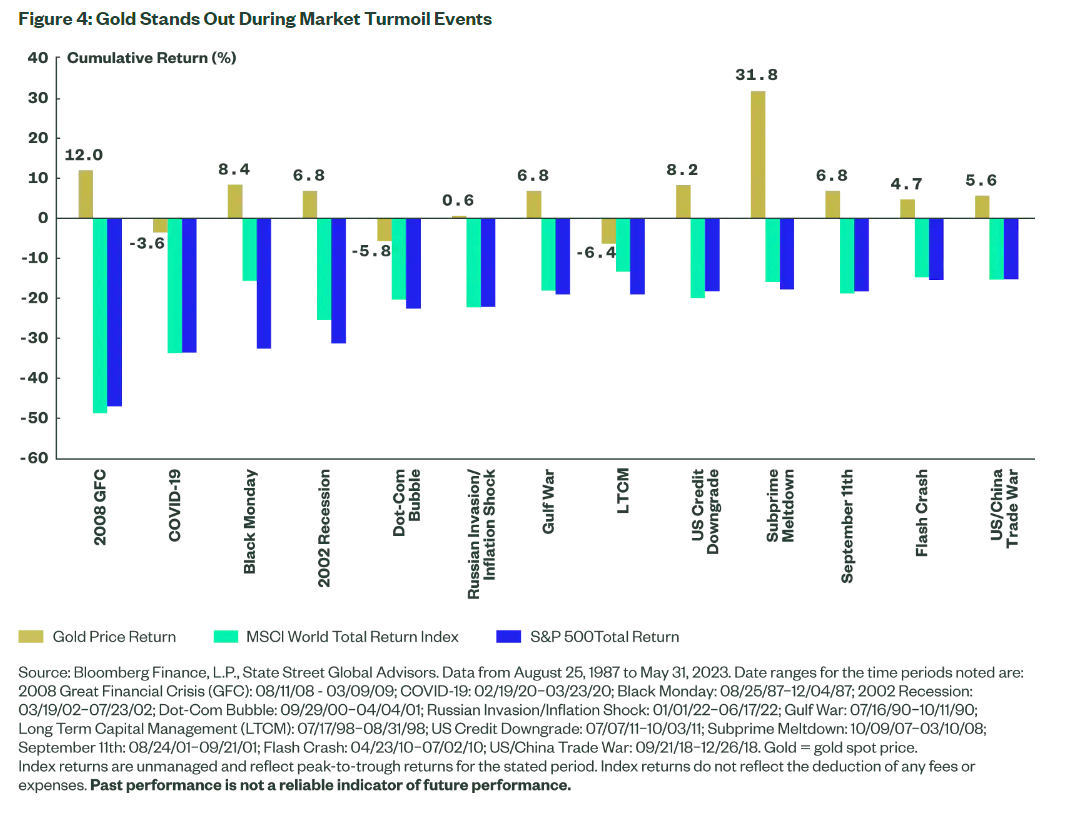
Gold has exhibited low correlations to financial assets over multiple market cycles; it also has a strong track record of protecting against both short- and long-term market volatility. Its ability to help protect portfolios against systemic market shocks and tail events stemming from a variety of crises (see Figure 4) may help reduce portfolio drawdowns resulting in potential portfolio performance improvement over time.
Looking at major drawdowns in US equity markets, gold has not only outperformed US equities on a relative basis, but also on an absolute basis in the majority of cases. During peak-to-trough drawdowns greater than 15% on the S&P 500® Index, gold averaged 5.8% total return versus -24.2% total return on the S&P 500 and -21.9% on the MSCI World Total Return Index.4 And during these 13 drawdown events, gold delivered positive returns in ten of those periods. In the three periods when gold had a negative return, it still reduced portfolio drawdowns and volatility when compared to a portfolio with no gold. Furthermore, gold tends to maintain gains over time even as markets recover.
Click here to read the full article
Glossary
Bloomberg Commodity Index Total Return
A broadly diversified commodity price total return index distributed by Bloomberg Indexes that tracks 22 commodity futures and seven sectors. No one commodity can compose less than 2 percent or more than 15 percent of the index, and no sector can represent more than 33 percent of the index.
Bloomberg Global Aggregate Total Return USD Index
A flagship measure of global investment grade debt from a multitude local currency markets. This multi-currency benchmark includes treasury, government-related, corporate and securitized fixed-rate bonds from both developed and emerging markets issuers.
Correlation
The correlation coefficient is a statistical measure of the strength of a linear relationship between two variables. Its values can range from -1 to 1.
LBMA Gold Price PM USD
The London Bullion Market Association (LBMA) Gold Price are the global benchmark prices for gold delivered in London. The LBMA Gold Price is determined twice each business day (10:30 a.m. and 3:00 p.m. London time) by the participants in a physically settled, electronic and tradable auction administered by ICE Benchmark Administration Limited (“IBA”).
MSCI ACWI Total Return Index
A market cap weighted equity total return index that includes both emerging and developed world markets.
MSCI World Total Return Index
MSCI World Total Return USD Index is a free-float weighted equity index which includes developed world markets, and does not include emerging markets.
Recession
A period of temporary economic decline during which trade and industrial activity are reduced.
S&P GSCI Total Return Index
The S&P GSCI Total Return Index in USD is widely recognized as the leading measure of general commodity price movements and inflation in the world economy. Index is calculated primarily on a world production weighted basis, comprised of the principal physical commodities futures contracts.
Spot Gold Price
The price in spot markets for gold. In US dollar terms, spot gold is referred to with the symbol “XAU,” which refers to the price of one troy ounce of gold in USD terms.
Volatility/Standard Deviation
Volatility is a statistical measure of the dispersion of returns for a given security or market index. In most cases, the higher the volatility, the riskier the security. Volatility is often measured from either the standard deviation or variance between returns from that same security or market index.
Footnotes
1Bloomberg Finance L.P., State Street Global Advisors. Gold price reflects US$/oz spot price, Global Equities: MSCI All Country World Index (ACWI) Total Return, Global Fixed Income: Bloomberg Global Aggregate Total Return Index. Data as of May 31, 2023.
2Bloomberg Finance L.P., State Street Global Advisors. Broad commodities represented by S&P GSCI Total Return Index. Data as of May 31, 2023.
3Bloomberg Finance L.P., State Street Global Advisors. Data as of May 31, 2023.
4Bloomberg Finance L.P., State Street Global Advisors. Data as of May 31, 2023.
5World Gold Council, State Street Global Advisors. Data as of March 31, 2023.
6Kitco, “China keeps buying gold: April’s 8-tonne purchase marks its 6-month shopping spree”, May 8, 2023.
7Bloomberg Finance L.P., State Street Global Advisors. Data as of May 31, 2023.
8Bloomberg Finance L.P., State Street Global Advisors. Data as of May 31, 2023.
—
Originally Posted June 14, 2023 – Gold Midyear Outlook: Interest Rates, Recession, and Risks Propel Gold Higher
Disclosure
The views expressed in this material are the views of the Gold Strategy Team as of May 31, 2023, and are subject to change based on market and other conditions. This document contains certain statements that may be deemed forward-looking statements. Please note that any such statements are not guarantees of any future performance and actual results or developments may differ materially from those projected.
The information provided does not constitute investment advice and it should not be relied on as such. It should not be considered a solicitation to buy or an offer to sell a security. It does not take into account any investor’s particular investment objectives, strategies, tax status or investment horizon. You should consult your tax and financial advisor.
The whole or any part of this work may not be reproduced, copied or transmitted or any of its contents disclosed to third parties without SSGA’s express written consent.
All information is from SSGA unless otherwise noted and has been obtained from sources believed to be reliable, but its accuracy is not guaranteed. There is no representation or warranty as to the current accuracy, reliability or completeness of, nor liability for, decisions based on such information and it should not be relied on as such.
Investing in commodities entail significant risk and is not appropriate for all investors. Commodities investing entail significant risk as commodity prices can be extremely volatile due to wide range of factors. A few such factors include overall market movements, real or perceived inflationary trends, commodity index volatility, international, economic and political changes, change in interest and currency exchange rates.
Disclosure: State Street Global Advisors
Do not reproduce or reprint without the written permission of SSGA.
All information has been obtained from sources believed to be reliable, but its accuracy is not guaranteed. There is no representation or warranty as to the current accuracy, reliability or completeness of, nor liability for, decisions based on such information and it should not be relied on as such.
State Street Global Advisors and its affiliates (“SSGA”) have not taken into consideration the circumstances of any particular investor in producing this material and are not making an investment recommendation or acting in fiduciary capacity in connection with the provision of the information contained herein.
ETFs trade like stocks, are subject to investment risk, fluctuate in market value and may trade at prices above or below the ETF’s net asset value. Brokerage commissions and ETF expenses will reduce returns.
Bonds generally present less short-term risk and volatility than stocks, but contain interest rate risk (as interest rates raise, bond prices usually fall); issuer default risk; issuer credit risk; liquidity risk; and inflation risk. These effects are usually pronounced for longer-term securities. Any fixed income security sold or redeemed prior to maturity may be subject to a substantial gain or loss.
Investing involves risk including the risk of loss of principal.
The whole or any part of this work may not be reproduced, copied or transmitted or any of its contents disclosed to third parties without SSGA’s express written consent.
Investing in high yield fixed income securities, otherwise known as “junk bonds”, is considered speculative and involves greater risk of loss of principal and interest than investing in investment grade fixed income securities. These Lower-quality debt securities involve greater risk of default or price changes due to potential changes in the credit quality of the issuer.
COPYRIGHT AND OTHER RIGHTS
Other third party content is the intellectual property of the respective third party and all rights are reserved to them. All rights reserved. No organization or individual is permitted to reproduce, distribute or otherwise use the statistics and information in this report without the written agreement of the copyright owners.
Definition:
Arbitrage: the simultaneous buying and selling of securities, currency, or commodities in different markets or in derivative forms in order to take advantage of differing prices for the same asset.
Fund Objectives:
SPY: The investment seeks to provide investment results that, before expenses, correspond generally to the price and yield performance of the S&P 500® Index. The Trust seeks to achieve its investment objective by holding a portfolio of the common stocks that are included in the index (the “Portfolio”), with the weight of each stock in the Portfolio substantially corresponding to the weight of such stock in the index.
VOO: The investment seeks to track the performance of a benchmark index that measures the investment return of large-capitalization stocks. The fund employs an indexing investment approach designed to track the performance of the Standard & Poor’s 500 Index, a widely recognized benchmark of U.S. stock market performance that is dominated by the stocks of large U.S. companies. The advisor attempts to replicate the target index by investing all, or substantially all, of its assets in the stocks that make up the index, holding each stock in approximately the same proportion as its weighting in the index.
IVV: The investment seeks to track the investment results of the S&P 500 (the “underlying index”), which measures the performance of the large-capitalization sector of the U.S. equity market. The fund generally invests at least 90% of its assets in securities of the underlying index and in depositary receipts representing securities of the underlying index. It may invest the remainder of its assets in certain futures, options and swap contracts, cash and cash equivalents, as well as in securities not included in the underlying index, but which the advisor believes will help the fund track the underlying index.
The funds presented herein have different investment objectives, costs and expenses. Each fund is managed by a different investment firm, and the performance of each fund will necessarily depend on the ability of their respective managers to select portfolio investments. These differences, among others, may result in significant disparity in the funds’ portfolio assets and performance. For further information on the funds, please review their respective prospectuses.
Entity Disclosures:
The trademarks and service marks referenced herein are the property of their respective owners. Third party data providers make no warranties or representations of any kind relating to the accuracy, completeness or timeliness of the data and have no liability for damages of any kind relating to the use of such data.
SSGA Funds Management, Inc. serves as the investment advisor to the SPDR ETFs that are registered with the United States Securities and Exchange Commission under the Investment Company Act of 1940. SSGA Funds Management, Inc. is an affiliate of State Street Global Advisors Limited.
Intellectual Property Disclosures:
Standard & Poor’s®, S&P® and SPDR® are registered trademarks of Standard & Poor’s® Financial Services LLC (S&P); Dow Jones is a registered trademark of Dow Jones Trademark Holdings LLC (Dow Jones); and these trademarks have been licensed for use by S&P Dow Jones Indices LLC (SPDJI) and sublicensed for certain purposes by State Street Corporation. State Street Corporation’s financial products are not sponsored, endorsed, sold or promoted by SPDJI, Dow Jones, S&P, their respective affiliates and third party licensors and none of such parties make any representation regarding the advisability of investing in such product(s) nor do they have any liability in relation thereto, including for any errors, omissions, or interruptions of any index.
BLOOMBERG®, a trademark and service mark of Bloomberg Finance, L.P. and its affiliates, and BARCLAYS®, a trademark and service mark of Barclays Bank Plc., have each been licensed for use in connection with the listing and trading of the SPDR Bloomberg Barclays ETFs.
Distributor: State Street Global Advisors Funds Distributors, LLC, member FINRA, SIPC, an indirect wholly owned subsidiary of State Street Corporation. References to State Street may include State Street Corporation and its affiliates. Certain State Street affiliates provide services and receive fees from the SPDR ETFs.
ALPS Distributors, Inc., member FINRA, is distributor for SPDR® S&P 500®, SPDR® S&P MidCap 400® and SPDR® Dow Jones Industrial Average, all unit investment trusts. ALPS Distributors, Inc. is not affiliated with State Street Global Advisors Funds Distributors, LLC.
Before investing, consider the funds’ investment objectives, risks, charges, and expenses. For SPDR funds, you may obtain a prospectus or summary prospectus containing this and other information by calling 1‐866‐787‐2257 or visiting www.spdrs.com. Please read the prospectus carefully before investing.
Disclosure: Interactive Brokers
Information posted on IBKR Campus that is provided by third-parties does NOT constitute a recommendation that you should contract for the services of that third party. Third-party participants who contribute to IBKR Campus are independent of Interactive Brokers and Interactive Brokers does not make any representations or warranties concerning the services offered, their past or future performance, or the accuracy of the information provided by the third party. Past performance is no guarantee of future results.
This material is from State Street Global Advisors and is being posted with its permission. The views expressed in this material are solely those of the author and/or State Street Global Advisors and Interactive Brokers is not endorsing or recommending any investment or trading discussed in the material. This material is not and should not be construed as an offer to buy or sell any security. It should not be construed as research or investment advice or a recommendation to buy, sell or hold any security or commodity. This material does not and is not intended to take into account the particular financial conditions, investment objectives or requirements of individual customers. Before acting on this material, you should consider whether it is suitable for your particular circumstances and, as necessary, seek professional advice.
Disclosure: Futures Trading
Futures are not suitable for all investors. The amount you may lose may be greater than your initial investment. Before trading futures, please read the CFTC Risk Disclosure. A copy and additional information are available at ibkr.com.


Join The Conversation
If you have a general question, it may already be covered in our FAQs. If you have an account-specific question or concern, please reach out to Client Services.