


By Emily Balsamo and Alison Coughlin
AT A GLANCE
- The two busiest locks on the Mississippi and Illinois rivers saw grain tonnage levels among the lowest in 10 years in fall 2023, reflecting lower river levels and strong foreign competition
- U.S. corn and soybean exports are highly dependent on river barges, and barge rates far exceeded normal seasonality this fall
Mississippi River levels have sunk to historic lows for the second consecutive autumn, creating headaches and high costs for farmers, elevators, and barge operators looking to export the 2023 harvest. The river is a critical venue for transporting corn and soybeans to international markets, with the majority of the nation’s export crop relying on river travel.
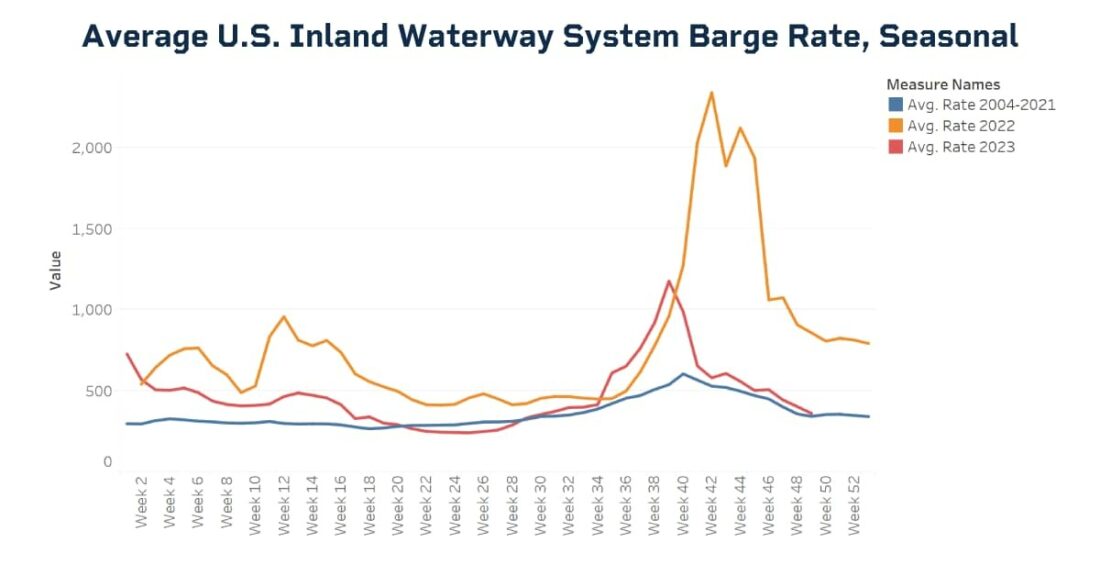
Inland barge rates in the United States tend to peak in October, when grain harvesting gets underway and traffic improves, though rates in 2022 and 2023 have far exceeded normal seasonality. Although river levels remain low, rates in recent weeks have fallen, reflecting lower export demand for corn and soybeans. Such dynamics interplay with longer-term historical trends: corn tonnage on the Mississippi and Illinois rivers shows general decline during the past decade, while soybean tonnage has held steady or increased.
Source: USDA AMS
A Dry Autumn, Again
A temperate and dry autumn in the Southern-Central United States sent Mississippi River levels plummeting once again. When the river sinks below normal accommodating levels, river transport becomes complicated because barges are unable to operate at full capacity. As the harvest got underway and American farmers brought their crops to market this October, stories of full elevators rejecting new grain behind a barge backstop abound. Some farmers who have been able to offload their harvest have complained of elevators recouping high barge rates by offering lower prices eroding farmers’ profits.
After a 2022 drought depressed river levels to historic lows, the Army Corp of Engineers has been reported to have spent the past few months dredging the river 24-hours a day with a 35-person crew to maintain a shippable path through the Mississippi. A shallower and narrower river, however, has proved inevitable and many barges are reported to have carried only two-thirds of normal capacity, with fewer barges moving this fall.
Rates Surge
Barge rates are published as a percentage, or multiplier, of local benchmark rates, which are issued in cents per ton. A barge rate of 500% applied to a local benchmark rate of 399 (399 cents per ton), for example, will functionally tariff one ton of grain by $19.95 (or $3.99 * (500/100)), or one bushel of corn by 50.67 cents. The average U.S. inland waterway system barge rate soared above 2,000% in October 2022 as rivers sank to levels unable to accommodate heavy traffic, forcing vessels to travel only partially loaded. The September 2023 spike, reaching an average regional rate of 1,176 cents per bushel on September 26, 2023, marked the second highest rate of the last 20 years.
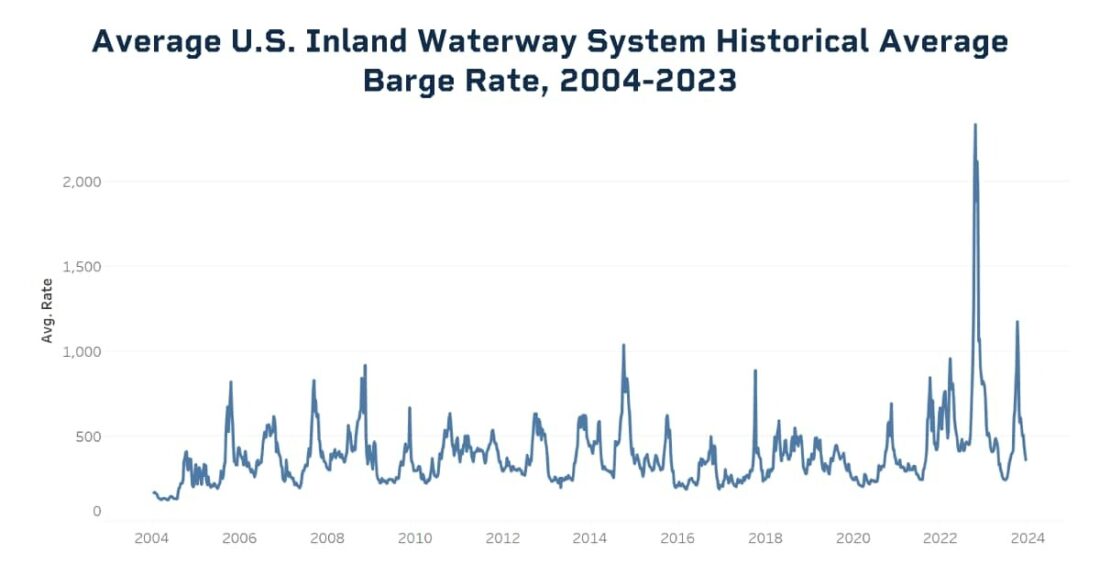
Source: USDA AMS
Rates through Cairo-Memphis, which stretch from the Mississippi-Ohio river confluence in Cairo, Illinois to Memphis, Tennessee tend to exhibit among the lowest barge rates for most of the year. However, rates in this region topped the waterway system with a rate of over 2,800% on October 11, 2022. The historically low water levels in Little Egypt led to barge congestion, driving the sharp price increases. Cairo-Memphis similarly topped the September 2023 rate spike.
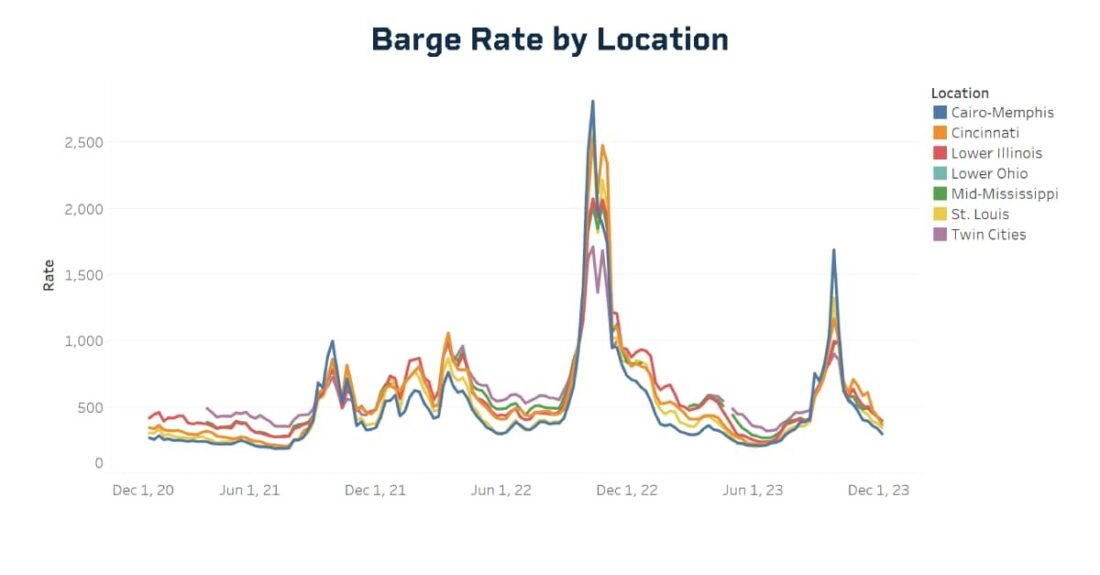
Rates tend to peak in late September and early October, as corn and soybeans are harvested, and exports pick up. While September 2023 rates on average exceed those of the year prior, rates in October 2023 were more normal despite persistently low water levels, a tendency potentially attributable to lower export demand. Some farmers have asserted that complicated Mississippi transport has given competing corn-and soybean-producing countries like Brazil an edge in the global market.
Source: USDA AMS
Tonnage Persists Long Term
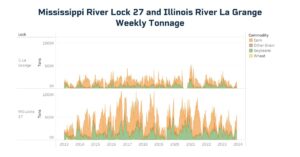
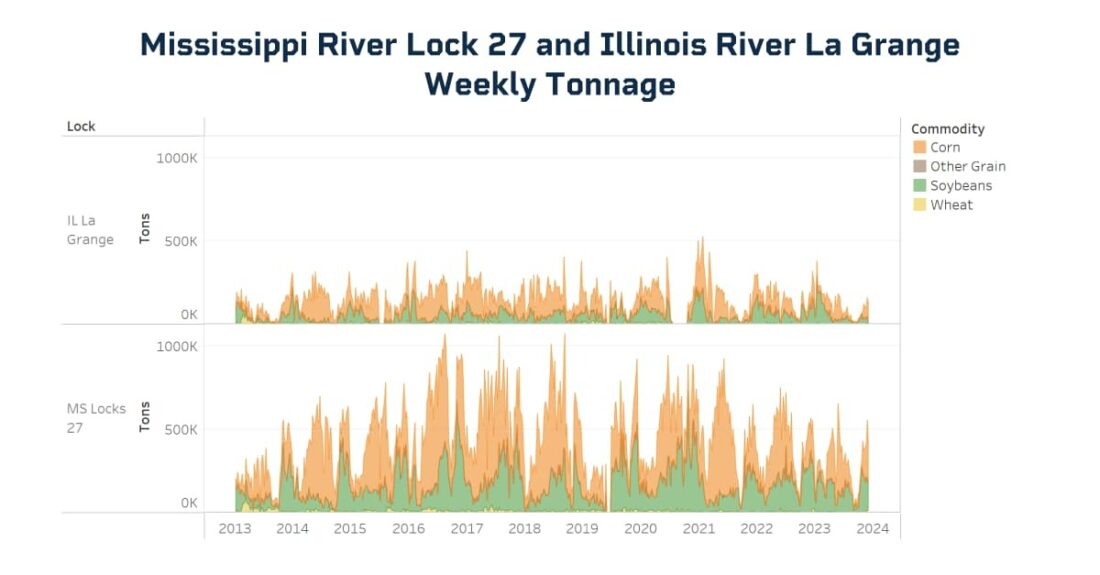
Downriver tonnage on the Mississippi, Illinois, and Ohio rivers is composed primarily of corn and soybeans, while upriver tonnage is predominantly fertilizer. Mississippi River Lock 27, located in Granite City, Illinois just north of St. Louis, sees the most traffic among Mississippi River locks according to the USDA barge dashboard. Lock 8 of the Illinois River, located in La Grange, represents traffic among Illinois River locks. Tonnage on Lock 27 in 2022 and 2023 is generally exceeded by historic levels, while recent months on Illinois River Lock 8 continue an historic trend.
Source: USDA AMS
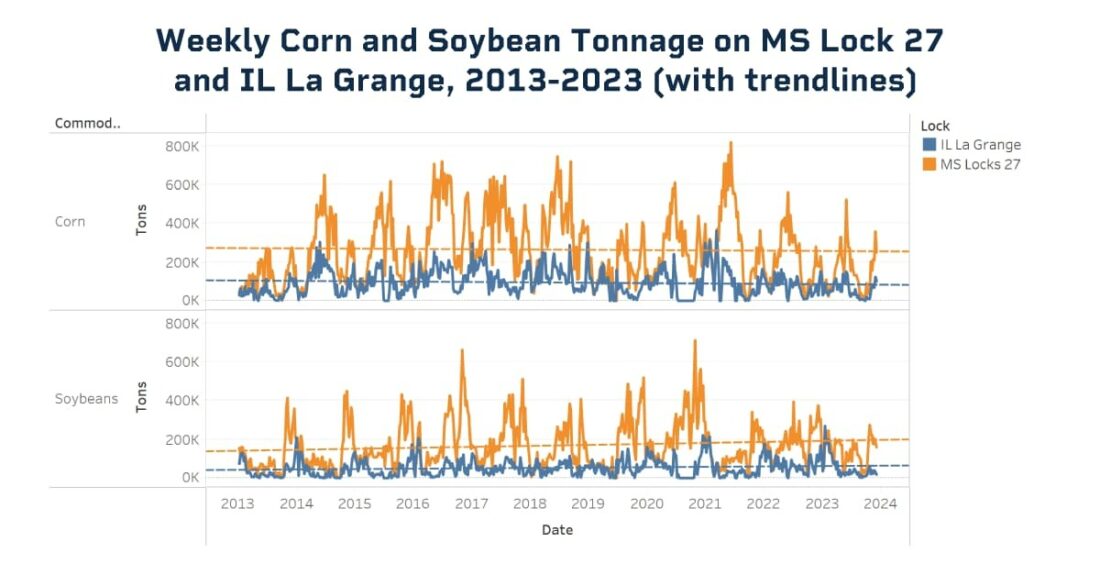
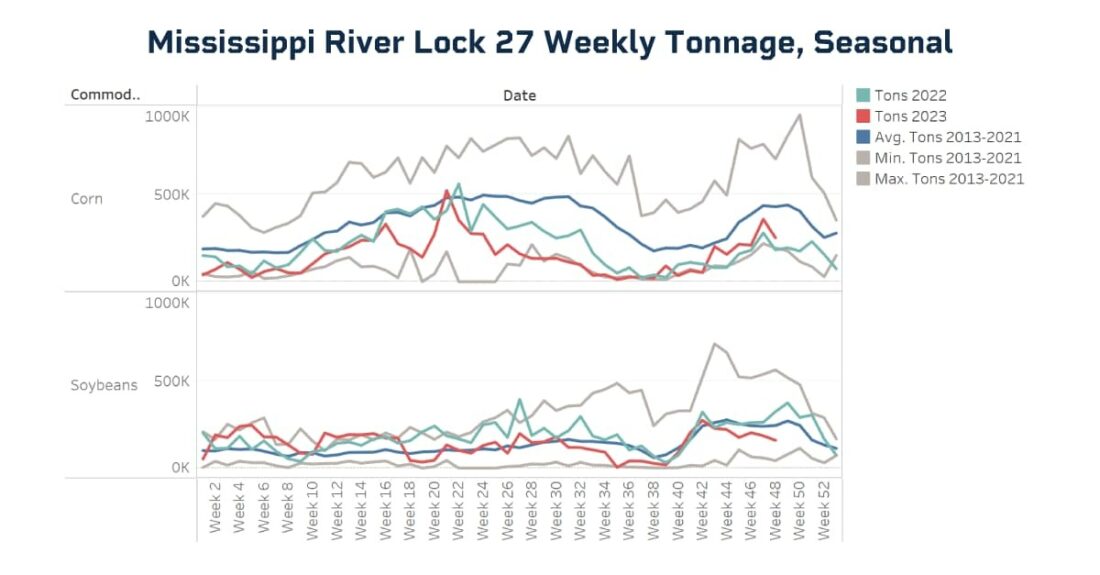
Weekly corn tonnage in 2022 and 2023 on Mississippi Lock 27 fell below historic averages for the first quarter of the year before rising toward the historic average, while 2023 weekly soybean tonnage at points during the second quarter exceeded historic highs. September 2023 tonnage was among the lowest in ten years, reflecting historically low river levels and South American competition.
Source: USDA AMS
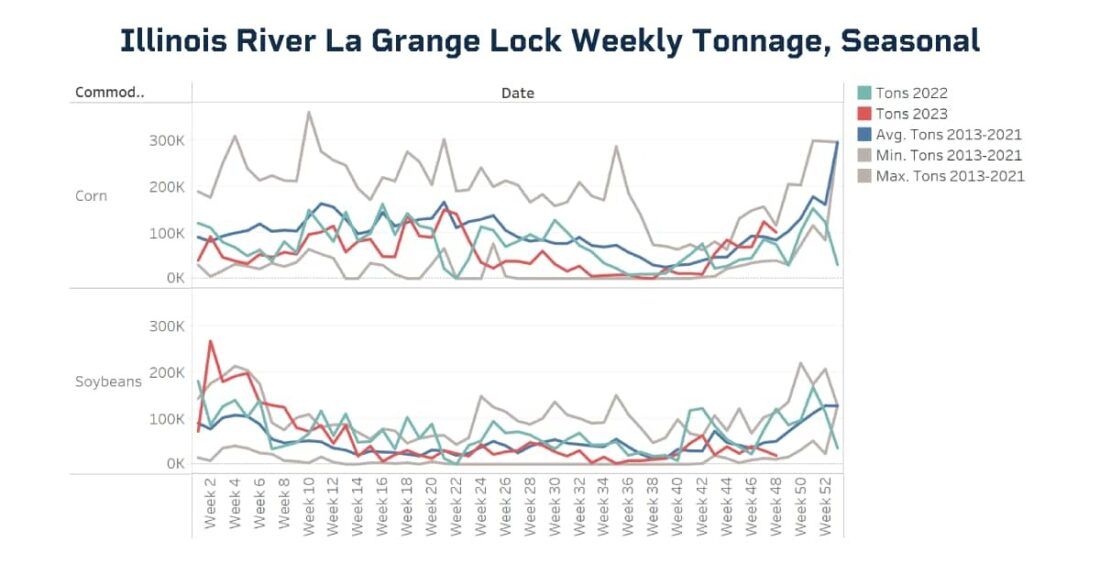
Illinois River weekly corn tonnage through La Grange falls short of historic averages in 2022 and 2023, despite showing relative strength in November 2023. Mirroring trends observed on the Mississippi River, weekly soybean tonnage in 2022 and 2023, however, exceeded historic averages for much of the year before falling in recent weeks.
Source: USDA AMS
Supporting the observation of stronger soybean flow relative to corn, the national balance sheets suggest that there is sufficient supply of corn, while soybeans look a bit tighter. That tighter soybean supply, low river water levels, and a large Brazilian harvest could suggest more prompt demand for U.S. soybeans relative to corn. Additionally, U.S. corn prices remain above corn prices in other global supply markets, making U.S. corn less desirable at the moment. If an elevator storing both corn and soybeans is faced with limited barge capacity, the commodity in higher export demand will be loaded.
Looking Ahead
Although the return of El Niño is expected to bring storms and heat to the Southeastern United States, more rain does not necessarily mean accommodative barge conditions. Heavy rains in June 2023, for example, followed drought, resulting in flooding on land not primed to absorb the deluge. As extreme weather brings unpredictability, barge rate volatility may prove the norm.
—
Originally Posted January 16, 2024 – Low River Levels are Creating Higher Costs for Farmers
Disclosure: Interactive Brokers
Information posted on IBKR Campus that is provided by third-parties does NOT constitute a recommendation that you should contract for the services of that third party. Third-party participants who contribute to IBKR Campus are independent of Interactive Brokers and Interactive Brokers does not make any representations or warranties concerning the services offered, their past or future performance, or the accuracy of the information provided by the third party. Past performance is no guarantee of future results.
This material is from CME Group and is being posted with its permission. The views expressed in this material are solely those of the author and/or CME Group and Interactive Brokers is not endorsing or recommending any investment or trading discussed in the material. This material is not and should not be construed as an offer to buy or sell any security. It should not be construed as research or investment advice or a recommendation to buy, sell or hold any security or commodity. This material does not and is not intended to take into account the particular financial conditions, investment objectives or requirements of individual customers. Before acting on this material, you should consider whether it is suitable for your particular circumstances and, as necessary, seek professional advice.
Disclosure: Futures Trading
Futures are not suitable for all investors. The amount you may lose may be greater than your initial investment. Before trading futures, please read the CFTC Risk Disclosure. A copy and additional information are available at ibkr.com.


Join The Conversation
If you have a general question, it may already be covered in our FAQs. If you have an account-specific question or concern, please reach out to Client Services.