


Producer costs of both sugar and breakfast cereals have recently been trending higher, contributing to inflated prices for several popular brands, and pushing certain consumer staples stocks lower.
Roughly half of the U.S. population start their day with a bowl of cereal – that’s according to National Cereal Day, which falls on March 7. The total amount of breakfast cereals sold each year adds up to a whopping 2.7 billion boxes – enough to wrap around the entire Earth thirteen times over.
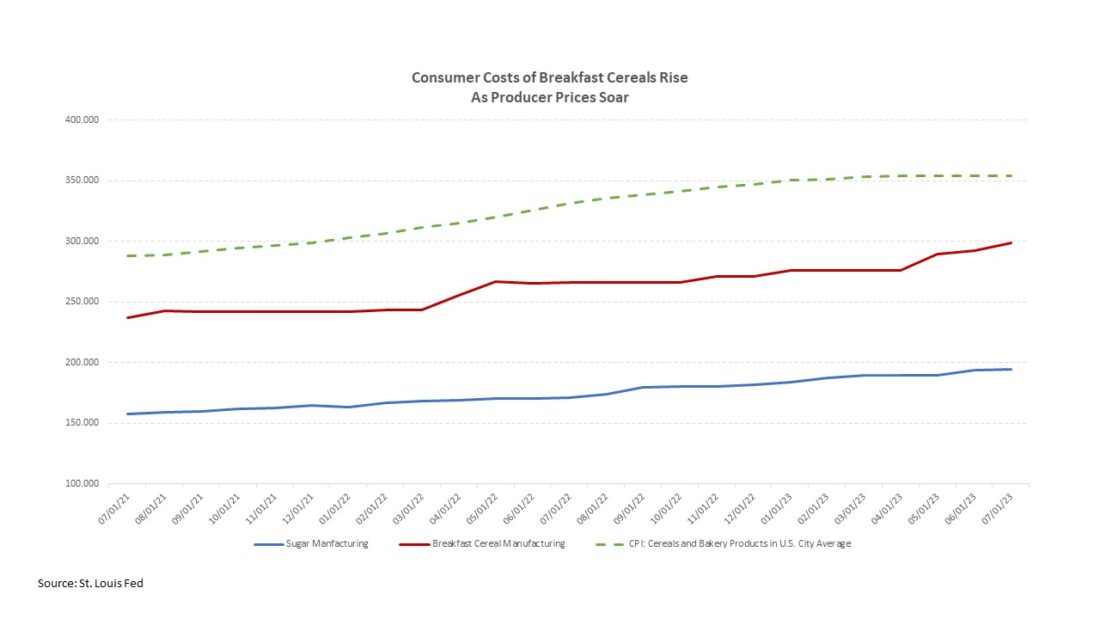
It is not surprising, then, that breakfast cereal prices have generally been on the climb, when considering the elevated expenses for the requisite manufacturing, along with the cost share of sugar as a raw material.
Digging Deep
In fact, consumers have generally found several iconic cereal brands priced at astronomically elevated levels.
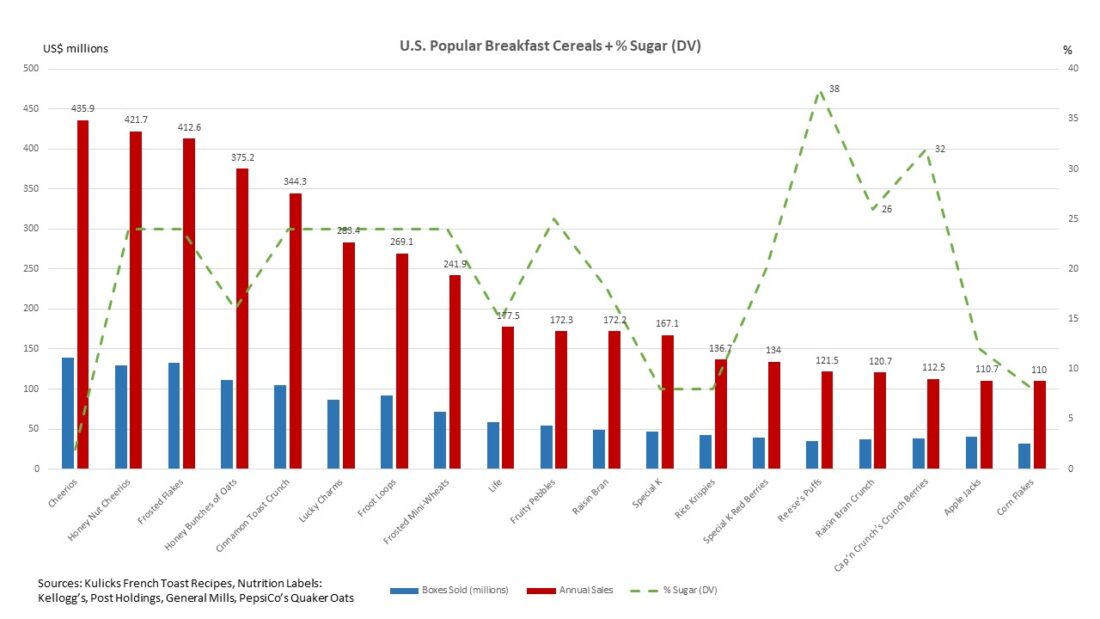
The average price for all cereals surged by more than 13.5% over the 12-month period ending in the first quarter of 2023, according to e-commerce platform Pattern, with brands such as Quaker Oats’ (NASDAQ: PEP) Cap’n Crunch’s Crunch Berries having soared roughly 114%. This spike means that those who paid $4.92 on Amazon for this cereal at the start of 2022 were checking out with a price tag of $10.53 only one year later.
Cap’n Crunch’s Crunch Berries were not alone. The cost for other popular cereals also skyrocketed, including an almost 37% spike in the price of General Mills’ (NYSE: GIS) Chex; a 23% uptick for Post’s (NYSE: POST) Fruity Pebbles; a rise of nearly 22.5% for Kellogg’s (NYSE: K) Froot Loops; and a 21.25% increase for Frosted Mini Wheats.
Producer Costs
The uptick falls against the backdrop of fairly steady increases in producer prices for sugar and breakfast cereal manufacturing, which rose 0.08% and 2.09% in July from the prior month and have ramped-up by 13.33% and 12.16% over the prior year, respectively.
The relationship between sugar and breakfast cereals appears quite closely correlated.
For example, a U.S. Department of Commerce study, using data from the Economic Census, showed that at 32.7%, the cost share of sugar as a raw material for breakfast cereals was the highest among all sugar-containing products – greater than nonchocolate (28.1%) and chocolate (19.1%) confectionery products, as well as ice cream and frozen dessert manufacturing (4.0%), and soft drinks (0.5%).
Cap’n Crunch’s Crunch Berries, which are laden with 43% sugar for every serving, sells an average of 38.3 million boxes annually, while General Mills’ Honey Nut Cheerios contains around 32.5% of sugar by serving and sells an average of 129.3 million boxes annually.
Moreover, although the FAO Sugar Price Index averaged 146.3 in July, down 3.9% from June – marking the second consecutive monthly decline – it remained 29.6% above its level in the same month last year.
The FAO attributed several factors to the lower price points, including positive progress in Brazil’s 2023/24 sugarcane harvest; improved soil moisture conditions across most growing areas in India; and sluggish import demand from Indonesia and China, the world’s largest sugar importers. However, the organization also pointed out that persistent concerns over the potential impact of the El Niño phenomenon on the 2023/24 sugarcane crops, particularly in Thailand, along with higher international crude oil prices, reined in world sugar price declines.
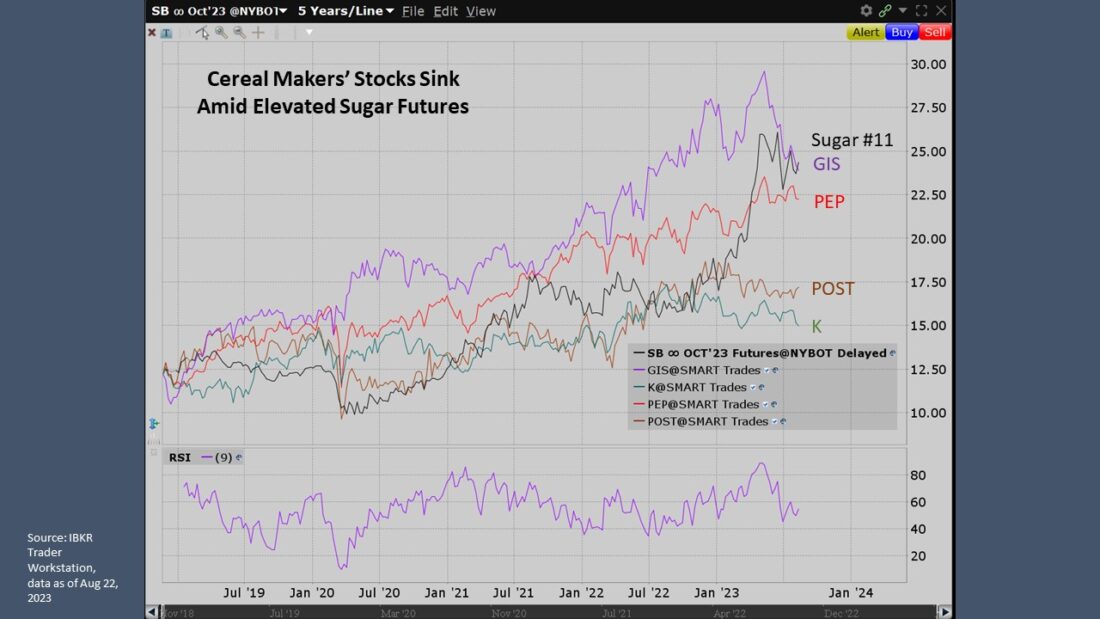
Similarly, while prices on the continuous contract for sugar futures (#11) have fallen a bit to around 23.40 from their 52-week highs of around 26.83 in May, they remain at materially high levels.
Meanwhile, lower coarse grain costs seem to have benefited the FAO Cereal Price Index, which edged down 0.5% month-over-month in July and 14.5% from the same year-ago month to 125.9.
Soggy Stocks & Sogging Credit
Overall, however, the adverse impacts from higher input costs of sugar have likely helped to dent the stock prices of the four dominant players in the ready-to-eat breakfast cereal business, as consumers may be shying away from brands with higher sugar content.
Year-to-date in 2023, shares of Kellogg Company have shed nearly 17.85% to US$68.37; General Mills has sunk 14.62% to US$60.85; Post Holdings is off a little more than 3.0% to US$87.23; and PepsiCo-owned Quaker Oats is lower by 1.29% to US$177.10.
Market participants’ perceptions of the creditworthiness of these consumer staples companies have also generally deteriorated, with spreads on most five-year credit default swaps (CDS) wider over the past three-month period:
| Company | Rating (M/S&P) | Cost (bps) | 3-Mo Change (bps) |
| Post Holdings | B1/B+ | 164.40 | +13 |
| General Mills | Baa2/BBB | 49.40 | +7 |
| PepsiCo | A1/A+ | 50.00 | +0.6 |
| Kellogg’s | Baa2/BBB | 79.30 | -1.5 |
The growth strategies of certain of these firms, including Post’s plans to acquire select brands from J.M Smucker Co. for US1.2 billion, as well as Kellogg’s eyed expansion in emerging markets and spin-off of its North American cereal business, may be hampering their credit outlooks.
Moody’s Investors Service recently highlighted that Kellogg’s faces sustained high financial leverage, stemming, in part, from its emerging market investment strategy for future sales growth, which has weighed on its margins and cash flows and has positioned the company “weakly” within its assigned ‘Baa2’, mid-tier, investment-grade rating category.
Among its debt outstanding, the Battle Creek, Michigan-based maker of iconic brands such as Corn Flakes, Raisin Bran, and Rice Krispies, has US$600 worth of maturities coming due in December 2023 and €600 million notes maturing May 2024.
The spin-off of its North American cereal business – to be named ‘WK Kellogg Co.’ and slated for completion by the end of 2023 – may help.
Together with ‘Kellanova’ – its remaining business, focused on global snacking, international cereal and noodles, plant-based foods, and North American frozen breakfast items – the two entities are expected to remain in investment-grade rating territory, with WK Kellogg Co. carrying leverage of around 2x, while Kellanova sustains debt-to-EBITDA of around 2.8x to under 3x.
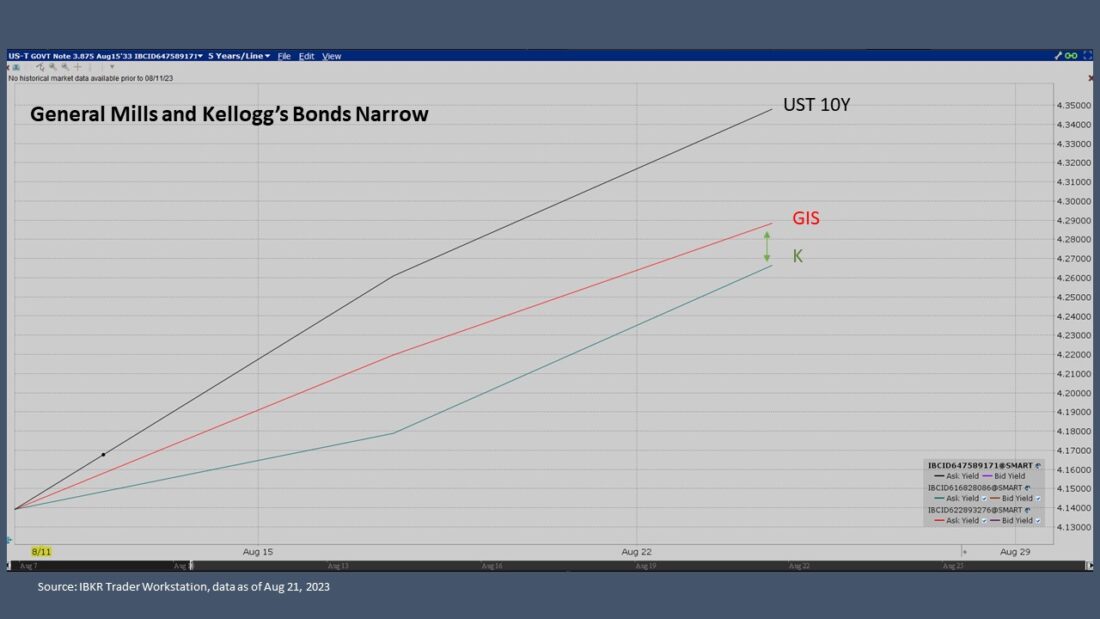
Certain recently issued, 10-year notes from Kellogg’s and General Mills have narrowed since their issuance in March – even as the yield on the benchmark Treasury has risen.
| Instrument | Yield | T+Spread at Issuance (bps) | T+Current Spread (bps) |
| K 5.25% Mar 1, 2033 | 5.700% | 140 | 136 |
| GIS 4.95% Mar 29, 2033 | 5.573% | 145 | 123 |
For its part, Moody’s said General Mills’ operating profit margins, which had improved in recent years through ongoing revenue management and cost efficiency initiatives, have come under some pressure due to cost inflation and supply chain challenges. The ratings agency expects some operating margin pressure in the year ahead, but anticipates margins will remain around the mid-teens area for the fiscal year ended May 2023.
Moody’s also expects recovery in 2024 and beyond as pricing is implemented and the rate of inflation stabilizes, with debt-to-EBITDA leverage to remain relatively flat, in the low 3x range.
Disclosure: Interactive Brokers
The analysis in this material is provided for information only and is not and should not be construed as an offer to sell or the solicitation of an offer to buy any security. To the extent that this material discusses general market activity, industry or sector trends or other broad-based economic or political conditions, it should not be construed as research or investment advice. To the extent that it includes references to specific securities, commodities, currencies, or other instruments, those references do not constitute a recommendation by IBKR to buy, sell or hold such investments. This material does not and is not intended to take into account the particular financial conditions, investment objectives or requirements of individual customers. Before acting on this material, you should consider whether it is suitable for your particular circumstances and, as necessary, seek professional advice.
The views and opinions expressed herein are those of the author and do not necessarily reflect the views of Interactive Brokers, its affiliates, or its employees.
Disclosure: Futures Trading
Futures are not suitable for all investors. The amount you may lose may be greater than your initial investment. Before trading futures, please read the CFTC Risk Disclosure. A copy and additional information are available at ibkr.com.


Join The Conversation
If you have a general question, it may already be covered in our FAQs. If you have an account-specific question or concern, please reach out to Client Services.