


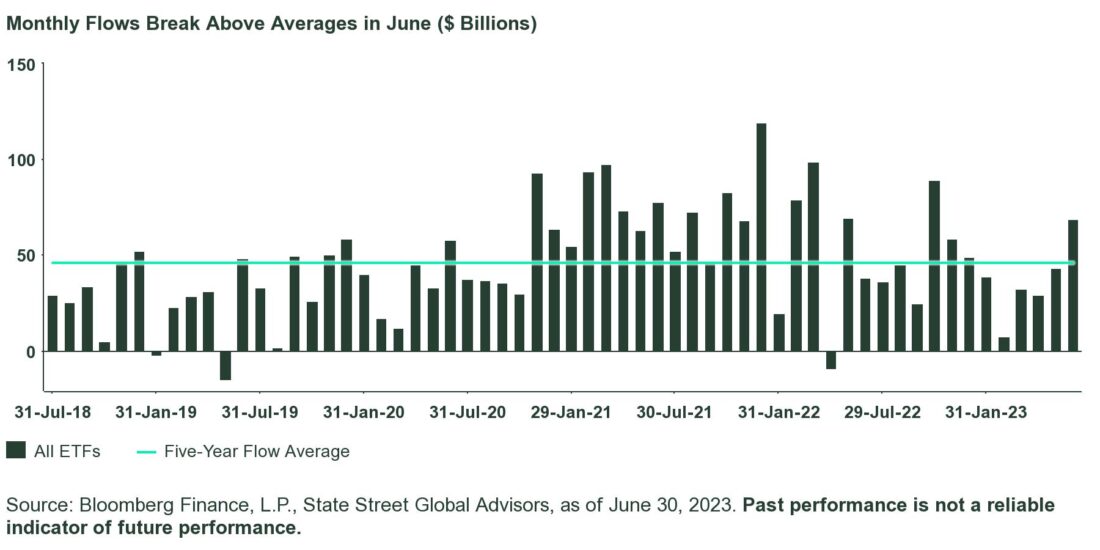
- ETFs took in $69 billion in June — their most in eight months and first time all year with above average inflows.
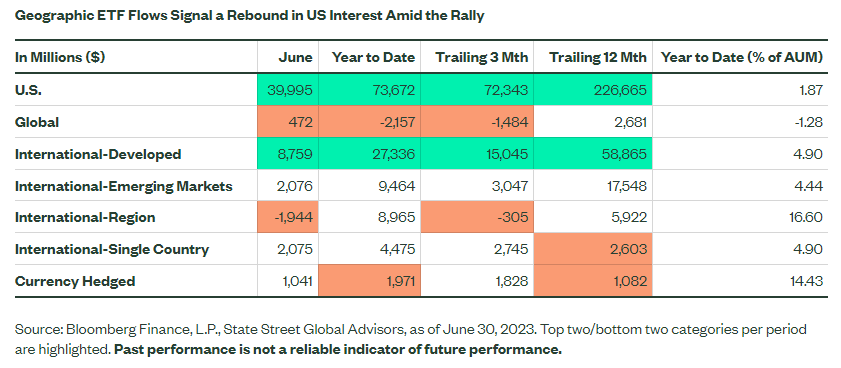
- US exposures, driven by large-cap flows, led geographies with $40 billion. Developed ex-US funds’ $9 billion added to their record streak of 36 months in a row with inflows.
- Bonds’ $18 billion of inflows in June was led by rate-sensitive markets. Yet, credit sensitive sectors added $3 billion, supported by the best-ever month for convertible exposures ($624 million).
Summertime evokes many nostalgic sounds. One is the sound of feet hitting a wooden dock, louder and louder, quicker and quicker, followed by a primal yell of “Cannonball!” Then a large splash, as joyous kids jump carefree into the water.
Kids are not the only ones jumping in as the summer starts. Despite gains prior to June, investors had shown restraint, illustrated by narrow market leadership and light positioning. In June, investors pushed that restraint aside and jumped back into the market — expressing courage instead of caution.
Global equities posted a 5.6% return, US small caps notched an 8% gain, and an equal weighted version of the S&P 500 Index outperformed the market cap weighted one for the first time in five months.1 The strong small cap and equal weighted S&P 500 returns indicate a broadening of leadership and more boats rising with the market’s tide.
Flows followed the outsized returns, as ETF fund flow positioning started to make some waves.
ETF Flows Start Summer with a Splash
June flows reveal how cautious investors, like a kid sitting on the edge of the dock watching friends play Marco Polo, finally took the leap and jumped into the market’s “rally fun” with both feet. It wasn’t a perfectly executed cannonball, but it did make a splash.
Total ETF inflows were $69 billion in June. While only the 14th best all-time, this was the strongest month of inflows since October 2022. It was also the first time all year that a month had above average flows, as shown in the chart below.
The strong June flows also pushed full-year totals to $220 billion, giving 2023 a puncher’s chance at breaking $500 billion in calendar year inflows for the fourth straight year. But only if averages hold.
Over the past five years, third quarter flows averaged $112 billion while fourth quarter flows averaged $178 billion. Prorating those totals (+$290 billion) alongside the current year-to-date figure, leads to a potential $510 billion of full-year flows in 2023.
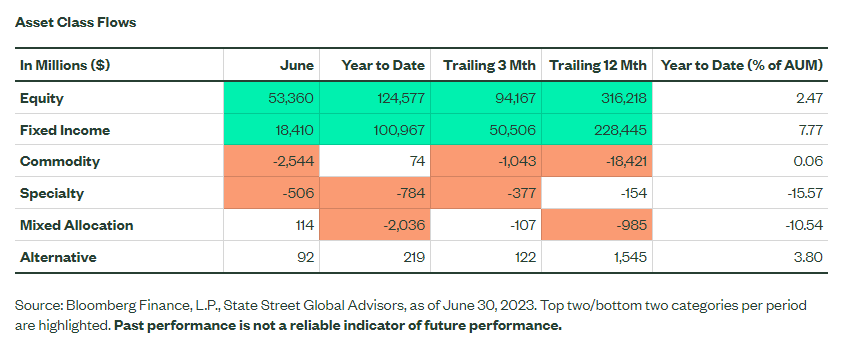
Equity funds took in $53 billion to lead all asset classes. Yet, bonds’ $18 billion was greater when viewed related to their asset base. Bond fund flows were 1.3% of their start-of-month assets compared to 1% for equities.
Bond inflows also pushed 2023 totals to over $100 billion, setting up a real probability that full-year flows could surpass $200 billion — a feat achieved in two out of the past three years.
June ETF Flows: A Party in the USA
US-focused exposures’ $40 billion represented the majority of the geographical flows last month. Their June flows also represent 54% of their own year-to-date figures, a stark illustration of how strong investors’ jump into the market’s rally was in June.
When viewed based on market cap segmentation, all US segments (large, mid, small, value, and growth) all had inflows in June, and are now all in net inflows year to date. And small caps had their highest inflows since November 2021, as investors sought to express a risk-on view, as well as a contrarian view on the current narrow market leadership.
Developed ex-US funds took in $8.7 billion in June, their eighth-most all time. It was also their record-setting 36th consecutive month with inflows and their 15th month in a row with more than $1 billion in inflows — another record.
Developed ex-US single country exposures (Japan, +$2.6 billion) led the $2 billion of inflows into the Single Country category. But it wasn’t all green for developed ex-US markets. European regional exposures had $2 billion of outflows in June, their first month of outflows this year. This negativity comes despite stronger than market returns in June (6.7% versus 5.6%) and 2023 (18.5% versus 12.8%), among other tailwinds.2
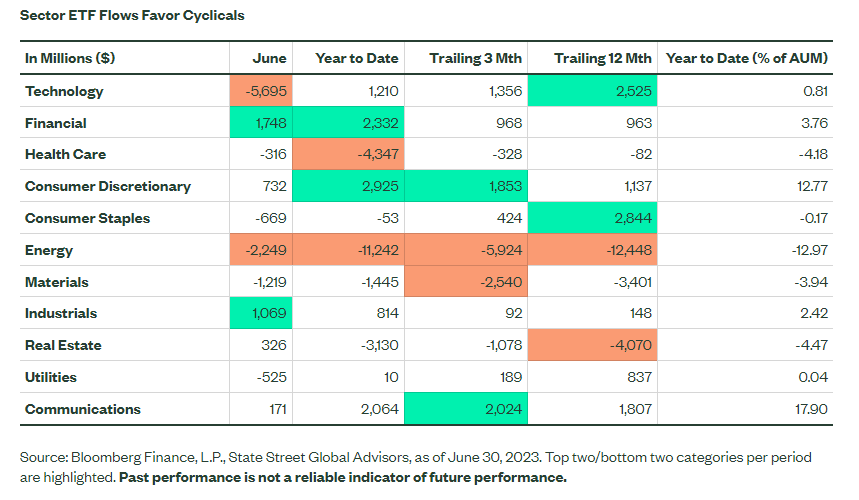
But it wasn’t party in USA for all exposures. Sector funds had $6 billion outflows in June. However, when excluding Tech outflows, which were a reversal of the rebalance-related inflows at the end of May that inflated that month’s totals, sectors shed just $932 million.
The non-Tech outflows were led by defensive sectors’ loss of $1.5 billion. Cyclical sectors, led by Financials and Industrials, took in $400 million, however.
This was the first time since October 2022 that cyclical inflows outpaced defensives. In fact, four out of the six cyclical sectors had inflows in June. And Energy, the cyclical with the largest outflows, has been in net outflows all year as the sector has trailed the market as a result of a decline in oil’s spot price and mean reversion following outsized returns in 2022 and 2021.
The positive flows into cyclicals is a potential sign of positivity beneath the broader sector surface. More allocations to cyclicals would indicate firmer risk-on positioning by investors, as well as their view that a recession may not be on the horizon.
Click here to read the full article
Footnotes
1 Bloomberg Finance, L.P, as of June 30, 2023 based on the MSCI ACWI Index, S&P 500 Index, and S&P 600 Small Cap Index
2 Based on the EuroStoxx 50 Index and the MSCI ACWI Index as of June 30, 2023 per Bloomberg Finance L.P.
3 Bloomberg Finance, L.P., as of June 30, 2023
4 Bloomberg Finance, L.P., as of June 30, 2023
5 FactSet as of June 30, 2023
6 Based on the Federal Reserve dot plots, June 30, 2023
7 Bloomberg Finance, L.P., as of June 30, 2023 based on the MSCI USA Quality Index
Glossary
S&P 500® Index is a market-capitalization-weighted stock market index that measures the stock performance of the 500 largest publicly traded companies in the United States.
MSCI ACWI Index is a market-capitalization-weighted stock market index that measures the stock performance of the companies in developed and emerging markets.
MSCI USA Quality Index is a an exposure of US firms with quality traits.
S&P 500 Equal Weighted Index is the equal-weight version of the widely-used S&P 500. The index includes the same constituents as the capitalization weighted S&P 500, but each company in the S&P 500 EWI is allocated a fixed weight – or 0.2% of the index total at each quarterly rebalance.
S&P 600 Small Cap Index is a market cap weighted index of the smallest 600 companies is the S&P 1500 Index.
EuroStoxx 50 Index is Europe’s leading blue-chip index for the Eurozone, provides a blue-chip representation of supersector in the region.
—
Originally Posted July 5, 2023 – ETF Investors Jump Back into the Market
Disclosures
The views expressed in this material are the views of the SPDR Research and Strategy team and are subject to change based on market and other conditions. It should not be considered a solicitation to buy or an offer to sell any security. It does not take into account any investor’s particular investment objectives, strategies, tax status or investment horizon. There is no representation or warranty as to the current accuracy of such information, nor liability for decisions based on such information. Past performance is not a reliable indicator of future performance.
Unless otherwise noted, all data and statistical information were obtained from Bloomberg LP and SSGA as of June 30, 2023. Data in tables have been rounded to whole numbers, except for percentages, which have been rounded to the nearest tenth of a percent.
The research and analysis included in this document have been produced by SSGA for its own investment management activities and are made available here incidentally. Information obtained from external sources is believed to be reliable and is as of the date of publication but is subject to change. This information must not be used in any jurisdiction where prohibited by law and must not be used in a way that would be contrary to local law or legislation. No investment advice, tax advice, or legal advice is provided herein.
Investing involves risk including the risk of loss of principal.
Bonds generally present less short-term risk and volatility than stocks, but contain interest rate risk (as interest rates raise, bond prices usually fall); issuer default risk; issuer credit risk; liquidity risk; and inflation risk. These effects are usually pronounced for longer-term securities. Any fixed income security sold or redeemed prior to maturity may be subject to a substantial gain or loss.
Equity securities may fluctuate in value in response to the activities of individual companies and general market and economic conditions.
Concentrated investments in a particular sector or industry tend to be more volatile than the overall market and increases risk that events negatively affecting such sectors or industries could reduce returns, potentially causing the value of the Fund’s shares to decrease.
The whole or any part of this work may not be reproduced, copied or transmitted or any of its contents disclosed to third parties without SSGA’s express written consent.
Disclosure: State Street Global Advisors
Do not reproduce or reprint without the written permission of SSGA.
All information has been obtained from sources believed to be reliable, but its accuracy is not guaranteed. There is no representation or warranty as to the current accuracy, reliability or completeness of, nor liability for, decisions based on such information and it should not be relied on as such.
State Street Global Advisors and its affiliates (“SSGA”) have not taken into consideration the circumstances of any particular investor in producing this material and are not making an investment recommendation or acting in fiduciary capacity in connection with the provision of the information contained herein.
ETFs trade like stocks, are subject to investment risk, fluctuate in market value and may trade at prices above or below the ETF’s net asset value. Brokerage commissions and ETF expenses will reduce returns.
Bonds generally present less short-term risk and volatility than stocks, but contain interest rate risk (as interest rates raise, bond prices usually fall); issuer default risk; issuer credit risk; liquidity risk; and inflation risk. These effects are usually pronounced for longer-term securities. Any fixed income security sold or redeemed prior to maturity may be subject to a substantial gain or loss.
Investing involves risk including the risk of loss of principal.
The whole or any part of this work may not be reproduced, copied or transmitted or any of its contents disclosed to third parties without SSGA’s express written consent.
Investing in high yield fixed income securities, otherwise known as “junk bonds”, is considered speculative and involves greater risk of loss of principal and interest than investing in investment grade fixed income securities. These Lower-quality debt securities involve greater risk of default or price changes due to potential changes in the credit quality of the issuer.
COPYRIGHT AND OTHER RIGHTS
Other third party content is the intellectual property of the respective third party and all rights are reserved to them. All rights reserved. No organization or individual is permitted to reproduce, distribute or otherwise use the statistics and information in this report without the written agreement of the copyright owners.
Definition:
Arbitrage: the simultaneous buying and selling of securities, currency, or commodities in different markets or in derivative forms in order to take advantage of differing prices for the same asset.
Fund Objectives:
SPY: The investment seeks to provide investment results that, before expenses, correspond generally to the price and yield performance of the S&P 500® Index. The Trust seeks to achieve its investment objective by holding a portfolio of the common stocks that are included in the index (the “Portfolio”), with the weight of each stock in the Portfolio substantially corresponding to the weight of such stock in the index.
VOO: The investment seeks to track the performance of a benchmark index that measures the investment return of large-capitalization stocks. The fund employs an indexing investment approach designed to track the performance of the Standard & Poor’s 500 Index, a widely recognized benchmark of U.S. stock market performance that is dominated by the stocks of large U.S. companies. The advisor attempts to replicate the target index by investing all, or substantially all, of its assets in the stocks that make up the index, holding each stock in approximately the same proportion as its weighting in the index.
IVV: The investment seeks to track the investment results of the S&P 500 (the “underlying index”), which measures the performance of the large-capitalization sector of the U.S. equity market. The fund generally invests at least 90% of its assets in securities of the underlying index and in depositary receipts representing securities of the underlying index. It may invest the remainder of its assets in certain futures, options and swap contracts, cash and cash equivalents, as well as in securities not included in the underlying index, but which the advisor believes will help the fund track the underlying index.
The funds presented herein have different investment objectives, costs and expenses. Each fund is managed by a different investment firm, and the performance of each fund will necessarily depend on the ability of their respective managers to select portfolio investments. These differences, among others, may result in significant disparity in the funds’ portfolio assets and performance. For further information on the funds, please review their respective prospectuses.
Entity Disclosures:
The trademarks and service marks referenced herein are the property of their respective owners. Third party data providers make no warranties or representations of any kind relating to the accuracy, completeness or timeliness of the data and have no liability for damages of any kind relating to the use of such data.
SSGA Funds Management, Inc. serves as the investment advisor to the SPDR ETFs that are registered with the United States Securities and Exchange Commission under the Investment Company Act of 1940. SSGA Funds Management, Inc. is an affiliate of State Street Global Advisors Limited.
Intellectual Property Disclosures:
Standard & Poor’s®, S&P® and SPDR® are registered trademarks of Standard & Poor’s® Financial Services LLC (S&P); Dow Jones is a registered trademark of Dow Jones Trademark Holdings LLC (Dow Jones); and these trademarks have been licensed for use by S&P Dow Jones Indices LLC (SPDJI) and sublicensed for certain purposes by State Street Corporation. State Street Corporation’s financial products are not sponsored, endorsed, sold or promoted by SPDJI, Dow Jones, S&P, their respective affiliates and third party licensors and none of such parties make any representation regarding the advisability of investing in such product(s) nor do they have any liability in relation thereto, including for any errors, omissions, or interruptions of any index.
BLOOMBERG®, a trademark and service mark of Bloomberg Finance, L.P. and its affiliates, and BARCLAYS®, a trademark and service mark of Barclays Bank Plc., have each been licensed for use in connection with the listing and trading of the SPDR Bloomberg Barclays ETFs.
Distributor: State Street Global Advisors Funds Distributors, LLC, member FINRA, SIPC, an indirect wholly owned subsidiary of State Street Corporation. References to State Street may include State Street Corporation and its affiliates. Certain State Street affiliates provide services and receive fees from the SPDR ETFs.
ALPS Distributors, Inc., member FINRA, is distributor for SPDR® S&P 500®, SPDR® S&P MidCap 400® and SPDR® Dow Jones Industrial Average, all unit investment trusts. ALPS Distributors, Inc. is not affiliated with State Street Global Advisors Funds Distributors, LLC.
Before investing, consider the funds’ investment objectives, risks, charges, and expenses. For SPDR funds, you may obtain a prospectus or summary prospectus containing this and other information by calling 1‐866‐787‐2257 or visiting www.spdrs.com. Please read the prospectus carefully before investing.
Disclosure: Interactive Brokers
Information posted on IBKR Campus that is provided by third-parties does NOT constitute a recommendation that you should contract for the services of that third party. Third-party participants who contribute to IBKR Campus are independent of Interactive Brokers and Interactive Brokers does not make any representations or warranties concerning the services offered, their past or future performance, or the accuracy of the information provided by the third party. Past performance is no guarantee of future results.
This material is from State Street Global Advisors and is being posted with its permission. The views expressed in this material are solely those of the author and/or State Street Global Advisors and Interactive Brokers is not endorsing or recommending any investment or trading discussed in the material. This material is not and should not be construed as an offer to buy or sell any security. It should not be construed as research or investment advice or a recommendation to buy, sell or hold any security or commodity. This material does not and is not intended to take into account the particular financial conditions, investment objectives or requirements of individual customers. Before acting on this material, you should consider whether it is suitable for your particular circumstances and, as necessary, seek professional advice.
Disclosure: ETFs
Any discussion or mention of an ETF is not to be construed as recommendation, promotion or solicitation. All investors should review and consider associated investment risks, charges and expenses of the investment company or fund prior to investing. Before acting on this material, you should consider whether it is suitable for your particular circumstances and, as necessary, seek professional advice.


Join The Conversation
If you have a general question, it may already be covered in our FAQs. If you have an account-specific question or concern, please reach out to Client Services.