


Short-term fixed income is meant to be boring. That comment is not meant to be dismissive of either the product or those who trade it. Short-term rates, particularly those considered to be risk-free, are a key component of every fundamental pricing model that comes to mind. Thus, I become curious, if not concerned, when I see pricing anomalies in the very products that are meant to comprise the backbone of our financial system.
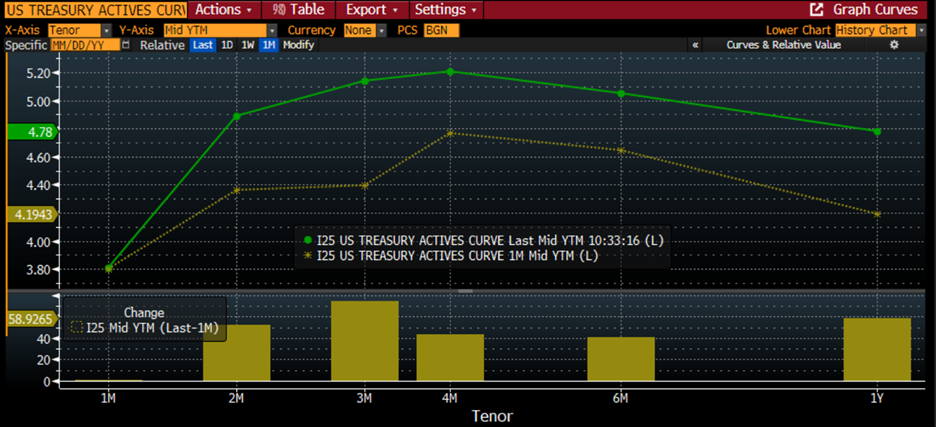
Let’s start with perhaps the most basic and liquid product that exists – US Treasury Bills. When we think of risk-free, this is usually what comes to mind. Yet we see a pronounced hump in the US Treasuries yield curve between 1- and 6-months. Note the exceptionally low rates on 1-month bills and the peak rate in the 3-4-month range (remember, last month’s 4-month bills are now this month’s 3-month bills). Traders are willing to pay a substantial premium for very short-term bills and are apparently avoiding those that mature in July.
US Treasury Actives Yield Curve, 1-Month to 1-Year Timeframe, Current T-Bill Rates (dark green line, top), Rates from 1 Month Ago (lighter green dots, top) and Price Changes in Basis Points (bottom)
Source: Bloomberg
There is a surprising amount of financial mayhem to unpack from this simple chart. The preference for ultra-short-term bills is a clear reaction to the banking concerns that were exposed about a month ago. This is evident when we compare the changes from two months ago to one month ago, when 1-month bill rates plunged from 4.60% to their current 3.80%
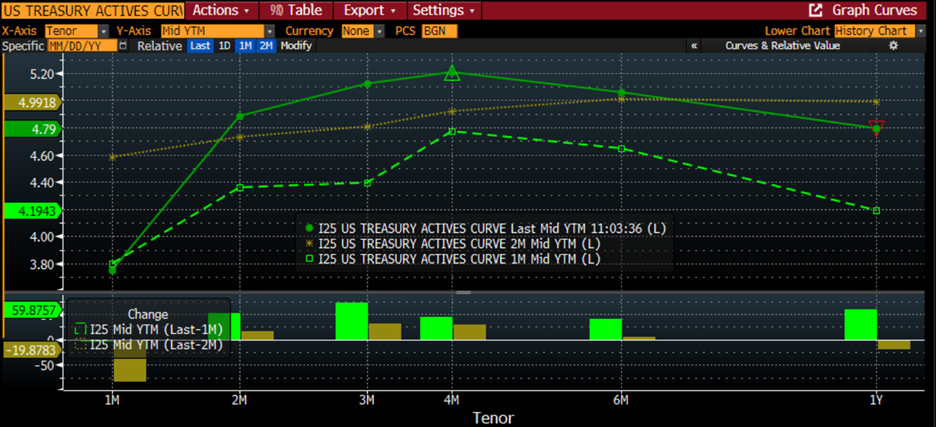
US Treasury Actives Yield Curve, 1-Month to 1-Year Timeframe, Current T-Bill Rates (dark green line, top), Rates from 1 Month Ago (lighter green dots, top), Rates from 2 Months Ago (green dashes) and Price Changes in Basis Points (bottom)
Source: Bloomberg
Prior to the banking crisis, 1-month rates were roughly in line with Fed Funds. Now they are about a full percentage point below.
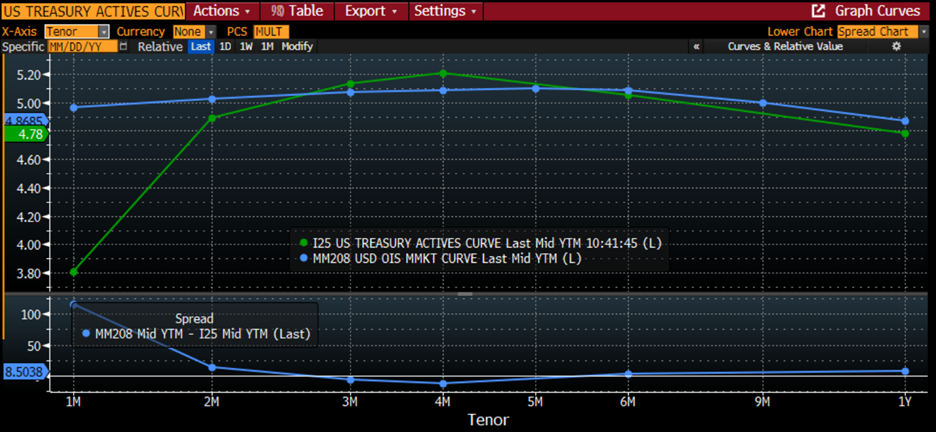
Yield Curves, 1-Month to 1-Year Timeframe, US Treasury T-Bill Rates (dark green line, top), US OIS Money Market Rates (blue line, top), Spread in Basis Points (bottom)
Source: Bloomberg
The banking concerns caused money to be withdrawn from bank deposits, but it had to go somewhere. Many thought that it would flow from smaller banks to their “too big to fail” counterparts, but we have been learning that those banks are not seeing an increase in deposits either. For example, Bank of America (BAC) reported a quarterly decline in deposits today. No, the money either flooded money market funds or was invested directly into T-bills. Either way, that has severely depressed ultra-short-term T-bill rates.
Money market funds offer stable $1 prices and easy withdrawals. The only way they can accomplish that is to invest their money in highly liquid, short-term assets. Guess what best fits that paradigm.
This is the dark side to the idea that the banking concerns are behind us. The discounted yield on ultra-short-term T-bills tells us that the money that was withdrawn from the banking system has not returned. It is still sitting in money markets funds. The problem for the economy is that this is an unproductive place for this money. Banks, at least in theory, lend that money for business loans, mortgages, and the like. Money in T-bills is simply being lent to the government. This could be a pronounced detriment to the economy if it persists.
Meanwhile, the T-bills are telling us that money market funds and others are avoiding bills that could be impacted by a government shutdown. We have been told that the Treasury is using extraordinary measures to avoid triggering the debt ceiling, and that those should last until June. Today is Tax Day, and the amount of those payments (including mine, ugh) should offer some clarity into the timing of when a shutdown might be imminent. Few believe that the US Government would fail to make payments to those who hold maturing bills, but there is a reasonable fear that the payments could be delayed. Money market fund managers appear to be showing some reluctance to be holding bills that could be affected in that manner.
So, we have two exciting things to monitor in this usually sleepy but fundamental corner of the financial universe. First, will the discounted yield on ultra-short-term notes disappear over time? If it persists, it tells us that while we might not think there is an ongoing bank crisis, we’re not fully confident about banks either. Second, will the “hump’ in rates for bills expiring in June-July persist, worsen, or vanish. That is the clearest signal about the market’s implicit likelihood for an uneventful end to the debt ceiling battle.
Join The Conversation
If you have a general question, it may already be covered in our FAQs. If you have an account-specific question or concern, please reach out to Client Services.
Leave a Reply
Disclosure: Interactive Brokers
The analysis in this material is provided for information only and is not and should not be construed as an offer to sell or the solicitation of an offer to buy any security. To the extent that this material discusses general market activity, industry or sector trends or other broad-based economic or political conditions, it should not be construed as research or investment advice. To the extent that it includes references to specific securities, commodities, currencies, or other instruments, those references do not constitute a recommendation by IBKR to buy, sell or hold such investments. This material does not and is not intended to take into account the particular financial conditions, investment objectives or requirements of individual customers. Before acting on this material, you should consider whether it is suitable for your particular circumstances and, as necessary, seek professional advice.
The views and opinions expressed herein are those of the author and do not necessarily reflect the views of Interactive Brokers, its affiliates, or its employees.


I suspect that the banking crisis will be slow to dissipate and that this hump in the T-Bill curve will gradually follow.
Seems that if banks need to reclaim the deposits that have migrated to money markets and t-bills they could do so by offering more attractive rates. If they did so on demand and short-term deposits that wouldn’t solve their problems. But if they offered positive real long-term deposit rates they’d require higher interest rates on loans to match.
“This is another fine mess you’ve gotten us into, Stanley!”-Oliver Hardy
The rate on the 1-month bill was definitely making me scratch my head. Thank you for this insight.
Excellent analysis! Thanks.