


By Lydia Hamill, FTSE Fixed Income and Multi-Asset Index Product Manager and Isabelle Wu, FTSE Fixed Income and Multi-Asset Index Product Senior Associate
Since 2017, AUM behind net zero benchmarks (both equity and fixed income) has increased from around $10.2bn to $100bn by April 2023 according to IIGCC, largely driven by passive strategies such as funds and ETFs (contributing approximately $76bn) [1]. Given this continuing fundamental shift from active to passive in the background, quality climate transition index solutions are essential in facilitating growth in AUM behind these strategies.
In particular, the importance of fixed income as an asset class cannot be understated. It has been estimated that between $109 and $275 trillion of cumulative investment will be required to meet global net-zero emissions by 2050[2], much of which will be financed by debt. More and more, investors are looking to implement sustainable investment solutions across their entire, multi-asset portfolios – but extending these strategies to fixed income is not a simple task, which we have discussed in detail before.
The European Union’s 2019 Regulation on EU Climate Transition Benchmarks was an important step in the standardisation of climate index approaches, with the aim of preventing potential fragmentation resulting from a lack of distinction between low-carbon indices and Paris-aligned indices. The Regulation created two new categories: EU Climate Transition Benchmarks (EU CTB) and EU Paris-Aligned Benchmarks (EU PAB). These benchmarks vary in their level of ambition, with the EU PAB setting more aggressive decarbonisation goals [3].
Despite this, there is still a wide variety of index methodologies to choose between when it comes to fixed income climate and net zero indices. This means that transparency among index providers is key, so that index users can easily navigate the solutions out there. Simple, sector-based exclusion approaches may be easier to follow as a foundational solution, but a tilting or optimised approach may provide a more sophisticated solution that allows investors to achieve the multiple sustainable investment targets of the PAB category, without excluding all of the high-emitting issuers that may be investing in low carbon technologies.
While PAB solutions do require the exclusion of companies involved in coal, oil, gas and highly intense energy production, it is important to note that exclusion of high emissions intensity companies, or even tilting away from these issues (but keeping them in), can divert capital away from supporting these efforts, i.e., “hitting the target whilst missing the mark [4]”. Unlike equity PAB and CTB solutions, there is no sector control mandated in the regulations to ensure that fixed income PAB and CTB solutions do not totally divest from high climate impact sectors.
While it is true that the vast majority of emissions reduction is achieved via exclusions in PAB approaches, due to the regulatory requirements, once the remaining companies are left, climate transition indices should ideally tilt towards companies that are more Paris-aligned than others, not just considering their current emissions intensity. This requires a forward-looking measure of carbon emissions intensity – which some PAB and CTB benchmark solutions in the market lack (resulting in the exclusion of companies that may have high emissions intensity today but are investing in reducing their emissions in the future).
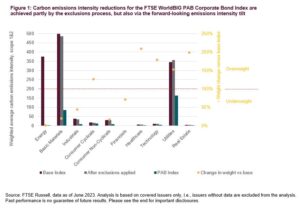
The FTSE Fixed Income EU Climate Benchmarks Index Series employs the Transition Pathway Initiative [5] dataset to combat this problem. This means that while the FTSE WorldBIG PAB Corporate Bond Index achieves ~38.9% of the emissions intensity reduction versus the base universe via exclusions, the full ~67.0% reduction is achieved after the tilting methodology is applied [6].
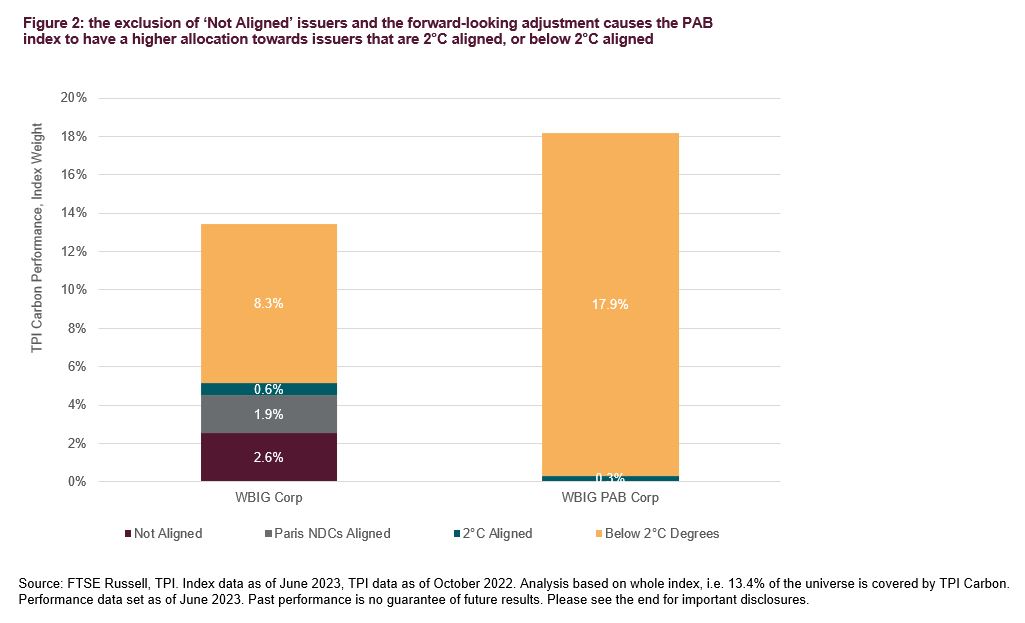
Specifically, the TPI Carbon Performance measure assesses the carbon emissions pathways of individual companies, and how this compares to the international targets and national pledges made as part of the UN Paris Agreement. Companies are categorised into 4 groups (below 2°C aligned, 2°C aligned, Paris NDC aligned and not aligned [7]), and their emissions intensity (which is used to over or under-weight them in the index) is adjusted accordingly. Hypothetically, if a company has high emissions intensity today, but it is ‘below 2°C aligned’, a multiplier is applied to reducethe punitive impact of the high emissions intensity, resulting in lesser underweight than would occur in the absence of such a forward-looking measure [8].
Another way of looking at this, is to look at the emissions intensity reduction by sector, at each stage in the process. For the Energy sector, most of the emissions intensity reduction occurs after exclusions. This is because the FTSE WorldBIG PAB Corporate Bond Index excludes issuers based on activities [9]; Oil, Gas and Coal, as well as Electricity generators, Tobacco, Controversial Weapons, Conduct (e.g., UNGC)) and Do No Significant Harm minimum exclusions. However, taking Basic Materials and Utilities as the other two relatively high intensity sectors, the bigger reduction occurs after tilting.

This results in a significant increase in the overall alignment status of the PAB index versus the base index, as shown by figure 2. The reason for this, is that the energy and basic materials sectors have only 24% and 19% of issuers being 2°C aligned or below, versus 59% of issuers in the Utilities sector. Due to this nuance, the utilities sector is overweight versus the base index, despite having relatively high emissions intensity versus, for example, Industrials. So, while the index does achieve the required emissions reduction via exclusions and tilting, the forward-looking adjustment is crucial in allocating weight to issuers that are contributing to the transition to a lower carbon economy.
Along a similar vein, with regards to ensuring funding is still being allocated to companies that are key to climate transition in fixed income specifically, one could explore green bond exposure as an additional tool. The FTSE Fixed Income EU Climate Benchmarks Index Series incorporates both an issuer level multiplier (paramount ratio of green bonds over total index-eligible bonds issued) and a bond-level multiplier. For the FTSE WorldBIG PAB Corporate Index, this increases green bond exposure from 4.1% to 8.3% as of March 2023 profiles.
Given the resurgence in green bond issuance we saw in Q1 2023, and some indicators of growth in corporate green bond issuance [1], such as the ‘green subsidy race’ between the US and the EU, this improvement could become more prominent in years to come. Indeed, any catalyst encouraging companies to increase their green capital spending will facilitate fixed income PAB and CTB solutions in achieving their required goals, year on year.
So, what can index providers do to try support the role of financial markets in transitioning to a low carbon economy, or a net zero pathway? As discussed here, they need to try to incorporate transparent, publicly available, forward-looking emissions intensity data into fixed income climate transition indices. This is crucial to avoid hitting the requirements of regulation (i.e. 30% or 50% lower emissions versus the base index), while simultaneously missing the true goal – to direct funds towards issuers that are transitioning their business models and investing in low-carbon technologies required for net zero pathways, and need capital allocated to them.
Beyond this, index providers need to make tracking these products as easy as possible, with transparent methodologies and thoughtful, clear handling for cases such as public issuers, or issuers for which no data is available [2]. Finally, robust infrastructure and governance processes are crucial for providers to incorporate investor feedback in this fast-evolving landscape, and to ensure data quality is high, instilling investor confidence in indices for the basis of passive net zero or climate transition funds.
For more information, please subscribe to our blog.
[1] IIGCC, Enhancing the Quality of Net Zero Benchmarks, May 2023, page 11.
[2] Green equity exposure in a 1.5°C scenario, FTSE Russell, September 2022
[3] For more detail and background on the minimum requirements required by regulation for PAB and CTB, please see ‘A Paris-Aligned Corporate Bond Benchmark’, FTSE Russell, May 2023
[4] IIGCC, Enhancing the Quality of Net Zero Benchmarks, May 2023
[5] The TPI’s methodology was developed by an international group of asset owners in partnership with the Grantham Research Institute on Climate Change and the Environment at the London School of Economics (LSE), supported by data from FTSE Russell. A robust approach was established based on objectivity, transparency and global application. For more details, please see the website.
[6] Scope 1 & 2 carbon emissions intensity, FTSE WorldBIG PAB Corporate Bond Index, as of June 2023 profiles.
[7] Companies may also be not assessed or lack sufficient disclosure to be assessed.
[8] For detailed calculations and methodology, please see page 13 of the Ground Rules.
[9] Exclusions are based on the Sustainalytics revenue thresholds. For a full list of exclusions and the associated thresholds, please see the FTSE Fixed Income EU Climate Benchmark Index Series Ground Rules.
—
Originally Posted June 19, 2023 – The critical role of fixed income indices in the climate transition
Disclosure: FTSE Russell
Interactive Advisors, a division of Interactive Brokers Group, offers FTSE Russell Index Tracker portfolios on its online investing marketplace. Learn more about the Diversified Portfolios.
This material is not intended as investment advice. Interactive Advisors or portfolio managers on its marketplace may hold long or short positions in the companies mentioned through stocks, options or other securities.
© 2023 London Stock Exchange Group plc and its applicable group undertakings (the “LSE Group”). The LSE Group includes (1) FTSE International Limited (“FTSE”), (2) Frank Russell Company (“Russell”), (3) FTSE Global Debt Capital Markets Inc. and FTSE Global Debt Capital Markets Limited (together, “FTSE Canada”), (4) MTSNext Limited (“MTSNext”), (5) Mergent, Inc. (“Mergent”), (6) FTSE Fixed Income LLC (“FTSE FI”), (7) The Yield Book Inc (“YB”) and (8) Beyond Ratings S.A.S. (“BR”). All rights reserved.
FTSE Russell® is a trading name of FTSE, Russell, FTSE Canada, MTSNext, Mergent, FTSE FI, YB and BR. “FTSE®”, “Russell®”, “FTSE Russell®”, “MTS®”, “FTSE4Good®”, “ICB®”, “Mergent®”, “The Yield Book®”, “Beyond Ratings®“ and all other trademarks and service marks used herein (whether registered or unregistered) are trademarks and/or service marks owned or licensed by the applicable member of the LSE Group or their respective licensors and are owned, or used under licence, by FTSE, Russell, MTSNext, FTSE Canada, Mergent, FTSE FI, YB or BR. FTSE International Limited is authorised and regulated by the Financial Conduct Authority as a benchmark administrator.
All information is provided for information purposes only. All information and data contained in this publication is obtained by the LSE Group, from sources believed by it to be accurate and reliable. Because of the possibility of human and mechanical error as well as other factors, however, such information and data is provided “as is” without warranty of any kind. No member of the LSE Group nor their respective directors, officers, employees, partners or licensors make any claim, prediction, warranty or representation whatsoever, expressly or impliedly, either as to the accuracy, timeliness, completeness, merchantability of any information or of results to be obtained from the use of the FTSE Russell products, including but not limited to indexes, data and analytics or the fitness or suitability of the FTSE Russell products for any particular purpose to which they might be put. Any representation of historical data accessible through FTSE Russell products is provided for information purposes only and is not a reliable indicator of future performance.
No responsibility or liability can be accepted by any member of the LSE Group nor their respective directors, officers, employees, partners or licensors for (a) any loss or damage in whole or in part caused by, resulting from, or relating to any error (negligent or otherwise) or other circumstance involved in procuring, collecting, compiling, interpreting, analysing, editing, transcribing, transmitting, communicating or delivering any such information or data or from use of this document or links to this document or (b) any direct, indirect, special, consequential or incidental damages whatsoever, even if any member of the LSE Group is advised in advance of the possibility of such damages, resulting from the use of, or inability to use, such information.
No member of the LSE Group nor their respective directors, officers, employees, partners or licensors provide investment advice and nothing contained herein or accessible through FTSE Russell products, including statistical data and industry reports, should be taken as constituting financial or investment advice or a financial promotion.
Past performance is no guarantee of future results. Charts and graphs are provided for illustrative purposes only. Index returns shown may not represent the results of the actual trading of investable assets. Certain returns shown may reflect back-tested performance. All performance presented prior to the index inception date is back-tested performance. Back-tested performance is not actual performance, but is hypothetical. The back-test calculations are based on the same methodology that was in effect when the index was officially launched. However, back- tested data may reflect the application of the index methodology with the benefit of hindsight, and the historic calculations of an index may change from month to month based on revisions to the underlying economic data used in the calculation of the index.
This document may contain forward-looking assessments. These are based upon a number of assumptions concerning future conditions that ultimately may prove to be inaccurate. Such forward-looking assessments are subject to risks and uncertainties and may be affected by various factors that may cause actual results to differ materially. No member of the LSE Group nor their licensors assume any duty to and do not undertake to update forward-looking assessments.
No part of this information may be reproduced, stored in a retrieval system or transmitted in any form or by any means, electronic, mechanical, photocopying, recording or otherwise, without prior written permission of the applicable member of the LSE Group. Use and distribution of the LSE Group data requires a licence from FTSE, Russell, FTSE Canada, MTSNext, Mergent, FTSE FI, YB, BR and/or their respective licensors.
Disclosure: Interactive Brokers
Information posted on IBKR Campus that is provided by third-parties does NOT constitute a recommendation that you should contract for the services of that third party. Third-party participants who contribute to IBKR Campus are independent of Interactive Brokers and Interactive Brokers does not make any representations or warranties concerning the services offered, their past or future performance, or the accuracy of the information provided by the third party. Past performance is no guarantee of future results.
This material is from FTSE Russell and is being posted with its permission. The views expressed in this material are solely those of the author and/or FTSE Russell and Interactive Brokers is not endorsing or recommending any investment or trading discussed in the material. This material is not and should not be construed as an offer to buy or sell any security. It should not be construed as research or investment advice or a recommendation to buy, sell or hold any security or commodity. This material does not and is not intended to take into account the particular financial conditions, investment objectives or requirements of individual customers. Before acting on this material, you should consider whether it is suitable for your particular circumstances and, as necessary, seek professional advice.
Disclosure: ETFs
Any discussion or mention of an ETF is not to be construed as recommendation, promotion or solicitation. All investors should review and consider associated investment risks, charges and expenses of the investment company or fund prior to investing. Before acting on this material, you should consider whether it is suitable for your particular circumstances and, as necessary, seek professional advice.


Join The Conversation
If you have a general question, it may already be covered in our FAQs. If you have an account-specific question or concern, please reach out to Client Services.