


Investors have been loading up on T-bills and money market funds this year, but according to our Total Return team, that is not a sustainable strategy as it exposes investors to both reinvestment risk and inflation while creating an asset/liability mismatch.
After a historically poor year for the bond market in 2022, investors came into this year looking to avoid another big drawdown. Understandably, the desire to preserve capital combined with the highest short-term yields in over two decades motivated investors to flock into short duration investments, particularly T-bills and money market funds. While we understand the sentiment and see the value for a portion of a portfolio, we think now is a good time to examine the proposition more closely. Like many things in life, when something seems too good to be true, it usually is.
Thanks to elevated short-term rates, the year-to-date return for the Bloomberg U.S. Treasury Bill 1-3 Months Index through April 30 was 1.5% (4.6%, annualized). That was a solid return, particularly for such short-dated securities, but it was significantly below the year-to-date return for the Bloomberg U.S. Aggregate Bond Index (the Agg) over that same stretch, which was 3.6% (11.4%, annualized). The Agg’s outperformance was due to capital appreciation from falling yields at the long end of the curve, which of course did not benefit T-bills as they have nearly zero duration. In fact, as we discuss below, falling short-term rates have essentially the opposite effect on short duration bonds.
Reinvestment Risk is the Primary Challenge
One of the key objectives of a fixed income allocation is to prepare for specific future funding needs: providing a pension for employees, building a factory, saving for retirement/education, etc. Given that most investors have multi-year (or multi-decade) time horizons, investing in 1-month T-bills and other short-dated assets creates an obvious mismatch. We recently experienced the real-world consequences of getting it wrong – albeit in the other direction – when several banks failed because their assets (U.S. Treasuries and mortgage-backed securities) had a much longer duration than their liabilities (overnight deposits).
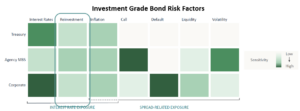
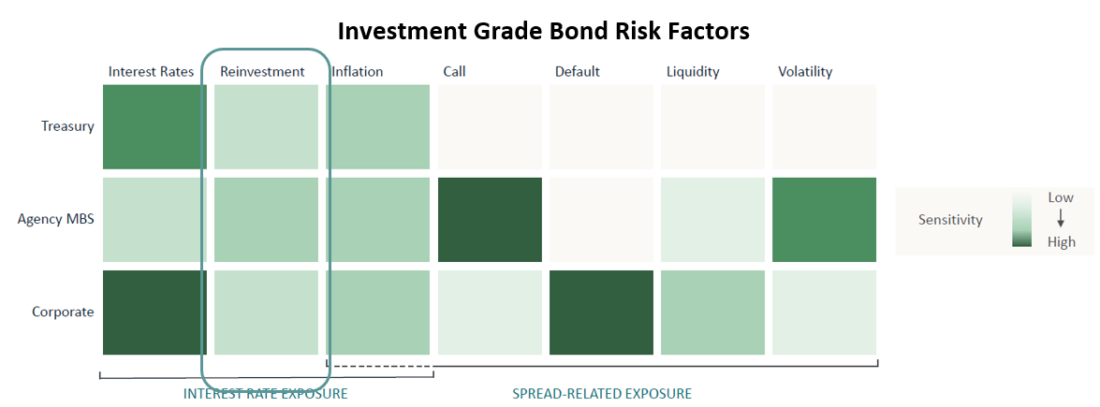
As you can see below in the Reinvestment Risk column of the heat map below, each of the major investment grade sectors is sensitive to this risk factor. The problem is that every time a short-term bond matures, the proceeds must be reinvested at the prevailing interest rate.
For example, when the year began, the 1-month T-bill (a zero-coupon bond that is sold at a discount) yielded roughly 4.0%, annualized. However, to realize that 4% return, you would need to buy the 1-month bill at 99.67 and redeem it at par every month for 12 months. It is easy to see the reinvestment risk inherent in this approach over a long time horizon. Eventually the fed funds rate will come down from its current level, and so too will the returns of T-bills.
T-Bills Erode Purchasing Power
Another issue with overweighting T-bills is that it is difficult to beat inflation, the silent killer of purchasing power in a portfolio. In 2023, the annualized yield of the 1-month Treasury bill has only beaten the monthly release of the year-over-year change in CPI (excluding Food and Energy) once.
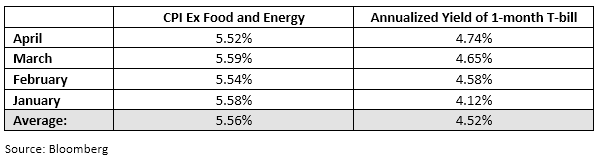
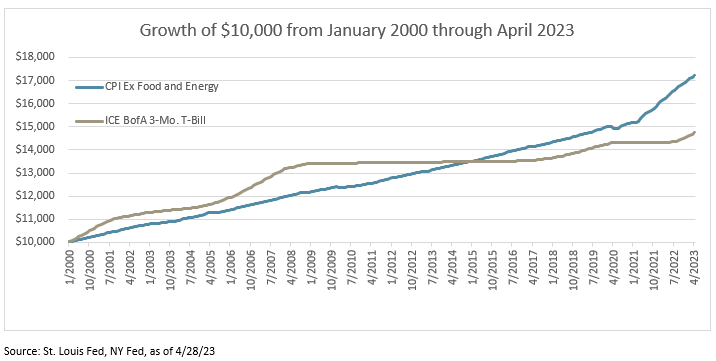
As you can see from the above table, the investor rolling T-bills has lost to inflation by an average of 104 basis points (1.04%) this year on an annualized basis. In addition, as the chart below shows, the cumulative returns for 3-month T-bills have lagged cumulative CPI since 2000.
Capital Appreciation is More Impactful Than Income
As the April year-to-date returns on the Agg demonstrated, under the right circumstances, capital appreciation can have a much larger impact on returns than the interest a bond pays. Consider that at the start of the year, the yield on the T-bill index was actually higher than the Agg. In other words, if interest rates had not changed during the period, and returns were entirely determined by the coupon each investor received, the T-bill index would have materially outperformed the Agg. However, because the Agg contains a mix of short and long-term bonds, it benefitted from falling rates, which is why it delivered such strong returns.
Portfolios that are heavily concentrated in short duration securities such as T-bills and money market funds are unable to benefit from this situation. Of course, the opposite is true, so it is important to deploy duration when interest rates are more likely to fall than to increase. In our view, now is a good time to start adding duration, as there are three key economic indicators that suggest rates are going to continue falling over the near to medium term: the shape of the yield curve, the direction of inflation, and recent comments from the Fed.
What is the Yield Curve Telling Us?
Regarding the inverted yield curve, there has been no lack of discussion of the implications of the shape as a predictor of a coming recession (which is not necessarily the case, as we have argued before). However, what is generally less appreciated is that an inverted curve mathematically predicts expected lower interest rates in the future.
Of course, the question of when that will actually happen is largely driven by the Fed, which takes its cues from changes in inflation. The curve has been inverted for over a year now, but for much of that time inflation was still increasing and the Fed was still raising rates.
But for the past few months, inflation has finally settled into a cooling trend (though it remains well above the Fed’s 2% target), opening the door for the Fed to stop hiking rates, which they hinted at during their last meeting.
When we look at all of these factors together, plus what we have already observed in 2023, we come away convinced that rates are likely past their near-term peak, which means now is a good time to add duration and take advantage of the capital appreciation that should present itself in the near future.
To put a finer point on this opportunity, one year after the end of the past three hiking cycles by the Fed (2000, 2006, and 2018), the fed funds rate fell by an average of 108 basis points and the yield on the 10-year Treasury fell by an average of 65 basis points. If the same thing were to happen this time, 1-month Treasuries would see their returns fall by roughly 1%, while 10-year Treasuries would generate a gain of over 5.6% due to capital appreciation (assuming a 3.375% coupon), generating a total return of ~8.9%.
Duration Performs Well in Uncertain Markets
Another reason we feel it is prudent to diversify out of short-term bonds (which we discussed in our latest quarterly outlook) is that a long duration position typically is the primary beneficiary of a shock to the risk markets. We saw this most recently when yields fell to generational lows during the onset of the Covid lockdowns. Other periods of disruption in the market, such as the Great Financial Crisis, September 11th, the 1987 stock market crash, etc., all saw substantial positive returns generated from a long duration position.
While it is nearly impossible to anticipate the next exogenous shock to the market, it seems as though the list of events that could spark a flight to quality grows by the day.
Final Thoughts
While we believe an allocation to short-term bonds makes sense for a portion of a portfolio, particularly assets that are earmarked for near-term expenses, we do not think it makes sense for the majority of fixed income assets, which are generally used to fund retirement portfolios. We firmly believe that inflation has peaked and will continue to fall, which will allow the Fed to cease hiking and eventually begin cutting rates, leading to long duration positions outperforming short maturity bonds.
—
Originally Posted May 30, 2023 – The Risk of Playing It Safe
The Osterweis Funds are available by prospectus only. The Funds’ investment objectives, risks, charges, and expenses must be considered carefully before investing. The summary and statutory prospectuses contain this and other important information about the Funds. You may obtain a summary or statutory prospectus by calling toll free at (866) 236-0050, or by visiting www.osterweis.com. Please read the prospectus carefully before investing to ensure the Fund is appropriate for your goals and risk tolerance.
The Osterweis Total Return Fund may invest in fixed income securities which are subject to credit, default, extension, interest rate and prepayment risks. It may also make investments in derivatives that may involve certain costs and risks such as liquidity, interest rate, market, credit, management and the risk that a position could not be closed when most advantageous. The Fund may invest in in debt securities that are un-rated or rated below investment grade. Lower-rated securities may present an increased possibility of default, price volatility or illiquidity compared to higher-rated securities. Investments in foreign and emerging market securities involve greater volatility and political, economic and currency risks and differences in accounting methods. These risks may increase for emerging markets. Leverage may cause the effect of an increase or decrease in the value of the portfolio securities to be magnified and the fund to be more volatile than if leverage was not used. Investments in preferred securities have an inverse relationship with changes in the prevailing interest rate. Investments in Asset Backed and Mortgage Backed Securities include additional risks that investors should be aware of such as credit risk, prepayment risk, possible illiquidity and default, as well as increased susceptibility to adverse economic developments. It may also make investments in derivatives that may involve certain costs and risks such as liquidity, interest rate, market, credit, management and the risk that a position could not be closed when most advantageous. The Fund may invest in municipal securities which are subject to the risk of default.
Investing involves risk. Principal loss is possible.
Diversification does not assure a profit, nor does it protect against a loss in a declining market.
Holdings and sector allocations may change at any time due to ongoing portfolio management and should not be considered a recommendation to buy or sell any security.
A corporate bond is a debt security issued by a corporation and sold to investors. The backing for the bond is usually the payment ability of the company, which typically depends on money to be earned from future operations. In some cases, the company’s physical assets may be used as collateral for bonds.
Treasuries (including bonds, notes, and bills) are securities sold by the federal government to consumers and investors to fund its operations. They are all backed by “the full faith and credit of the United States government” and thus are considered free of default risk.
A mortgage-backed security (MBS) is a type of asset-backed security that is secured by a mortgage or collection of mortgages. Agency MBS securities are issued by quasi-government entities and carry an implied guarantee by the federal government.
The Bloomberg U.S. Aggregate Bond Index is an unmanaged index which is widely regarded as the standard for measuring U.S. investment grade bond market performance.
The Bloomberg U.S. Treasury Bill: 1-3 Months Index is an unmanaged index designed to measure the performance of public obligations of the U.S. Treasury that have a remaining maturity of greater than or equal to 1 month and less than 3 months.
ICE BofA 3-Month Treasury Bill Index is a monthly-rebalanced index that consists of a single Treasury Bill issue that matures closest to, but not beyond, three months. Effective 6/30/22, the ICE index reflects transactions costs.
Effective 6/30/22, the ICE indices reflect transactions costs. Any ICE index data referenced herein is the property of ICE Data Indices, LLC, its affiliates (“ICE Data”) and/or its Third Party Suppliers and has been licensed for use by OCM. ICE Data and its Third Party Suppliers accept no liability in connection with its use. See https://www.osterweis.com/glossary for a full copy of the Disclaimer.
These indices do not incur expenses and are not available for investment. These indices reflect the reinvestment of dividends and/or interest. Historical fixed income index data is provided for informational purposes only, not as an indication of future Fund performance. Source: Bloomberg Indices. It is not possible to invest directly in an index.
A basis point is a unit that is equal to 1/100th of 1%.
Investment grade bonds are those with high and medium credit quality as determined by ratings agencies.
The fed funds rate is the rate at which depository institutions (banks) lend their reserve balances to other banks on an overnight basis.
Osterweis Capital Management is the adviser to the Osterweis Funds, which are distributed by Quasar. [OSTE-20230524-0881]
Disclosure: Interactive Brokers
Information posted on IBKR Campus that is provided by third-parties does NOT constitute a recommendation that you should contract for the services of that third party. Third-party participants who contribute to IBKR Campus are independent of Interactive Brokers and Interactive Brokers does not make any representations or warranties concerning the services offered, their past or future performance, or the accuracy of the information provided by the third party. Past performance is no guarantee of future results.
This material is from Osterweis Capital Management and is being posted with its permission. The views expressed in this material are solely those of the author and/or Osterweis Capital Management and Interactive Brokers is not endorsing or recommending any investment or trading discussed in the material. This material is not and should not be construed as an offer to buy or sell any security. It should not be construed as research or investment advice or a recommendation to buy, sell or hold any security or commodity. This material does not and is not intended to take into account the particular financial conditions, investment objectives or requirements of individual customers. Before acting on this material, you should consider whether it is suitable for your particular circumstances and, as necessary, seek professional advice.


Join The Conversation
If you have a general question, it may already be covered in our FAQs. If you have an account-specific question or concern, please reach out to Client Services.