


AT A GLANCE
- Treasury options traders began pricing the 2-year yield risk to the downside and 10 and 30-year to the upside beginning in July
- With both intraday and historical options values available, traders can use the CVOL Index to identify short term changes in volatility and diversions from historical normal levels
The 10-year Treasury note and 30-year bond suddenly moved to their highest yields in 16 years on Oct. 3. While few could have predicted such a move, a closer look at treasury market volatility reveals a trend of yield expectations moving incrementally higher on the long end of the yield curve over the past few months.
Recent futures and options price action in CME Group Treasury products provide an illustrative case study for using the valuable CVOL tool. CVOL measures 30-day forward looking implied volatility, incorporating every strike price on the implied volatility curve. The inclusion of every strike in the index calculation provides market participants with a representative value of implied volatility levels in each options series, and the simple variance methodology makes the index calculation straightforward and easy to understand.
In addition to calculating 30-day implied volatility, CVOL also generates several other measures, including skew. Skew refers to the idea that different strikes and calls and puts, even on the same underlying and expiration, can trade at different implied volatility levels.
We will use CME Group Micro Treasury Yield futures as a proxy for on-the-run Treasury rates and CVOL in yield terms based on CME’s standard Treasury options in the current paper.
Treasury Volatility Since July
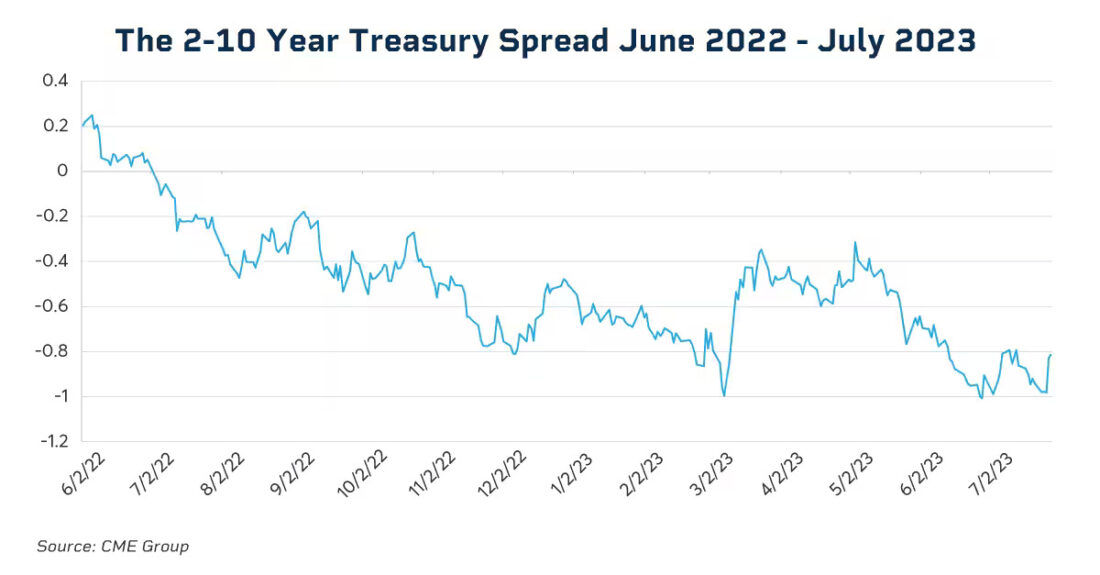
In early July 2022, the 2-year and 10-year U.S. Treasury yields inverted, meaning that the 2-year began yielding a higher rate than the 10-year. This is a closely watched relationship as such inversions have historically predicted an economic recession. This inversion has persisted, and the magnitude of the inversion approached 100 basis points in March 2023 and again in July. Incidentally, the 2-year has also yielded higher rates than the 30-year throughout this time.
On July 28, 2023, the 2s versus 10s inversion traded at a level of -81.5 basis points (and the 2s vs 30s traded at -73.8 basis points).
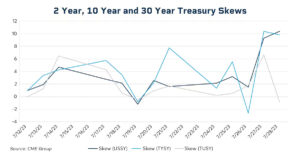
On that same day, the skew, again in yield terms, of the 2-year began to diverge from that in the 10 and 30-year. The 2-year skew became negative, indicating a put skew while the 10 and 30-year continued to trade with a call skew. In other words, Treasury options traders began pricing the 2-year yield risk to the downside and 10 and 30-year to the upside.
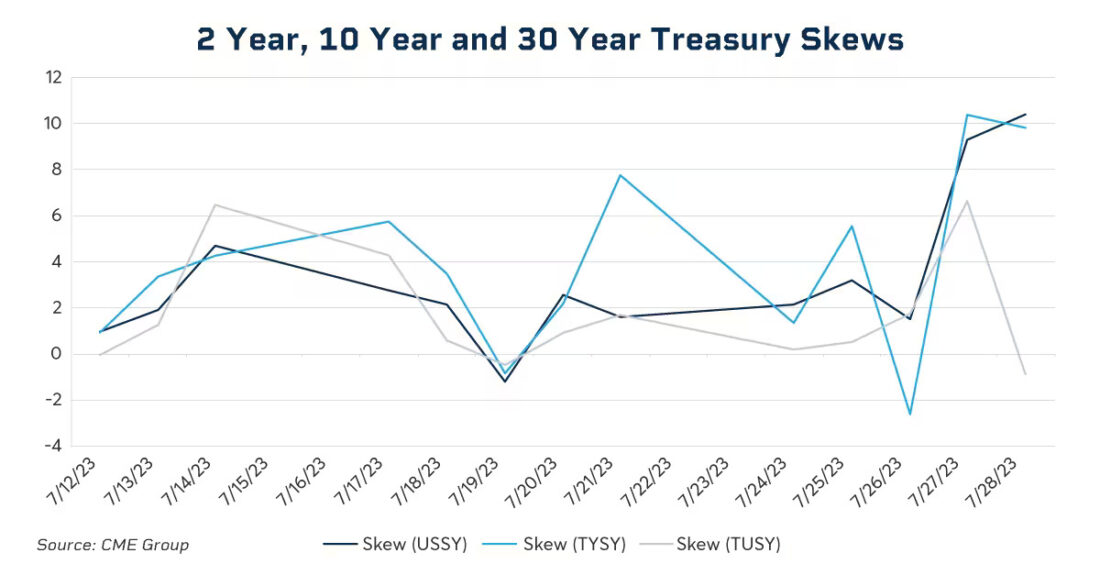
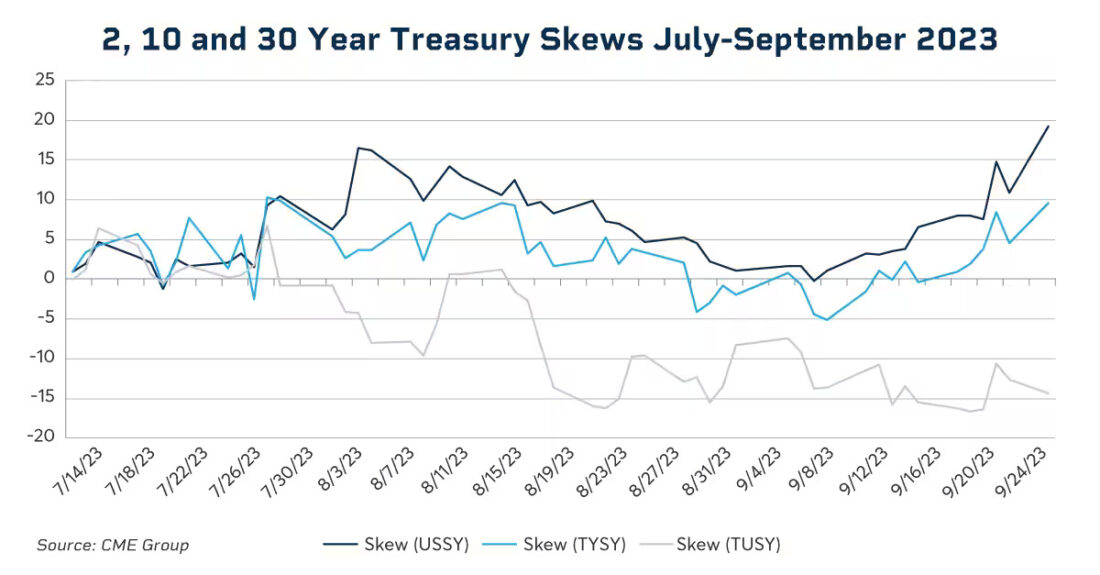
This divergence in skew continued and, in fact, became more pronounced through late September:
During that same time, the difference between the 2-year and 10-year yield declined from 81.5 basis points to just over 50 basis points (and the 2s versus 30s declined to about 42 basis points):
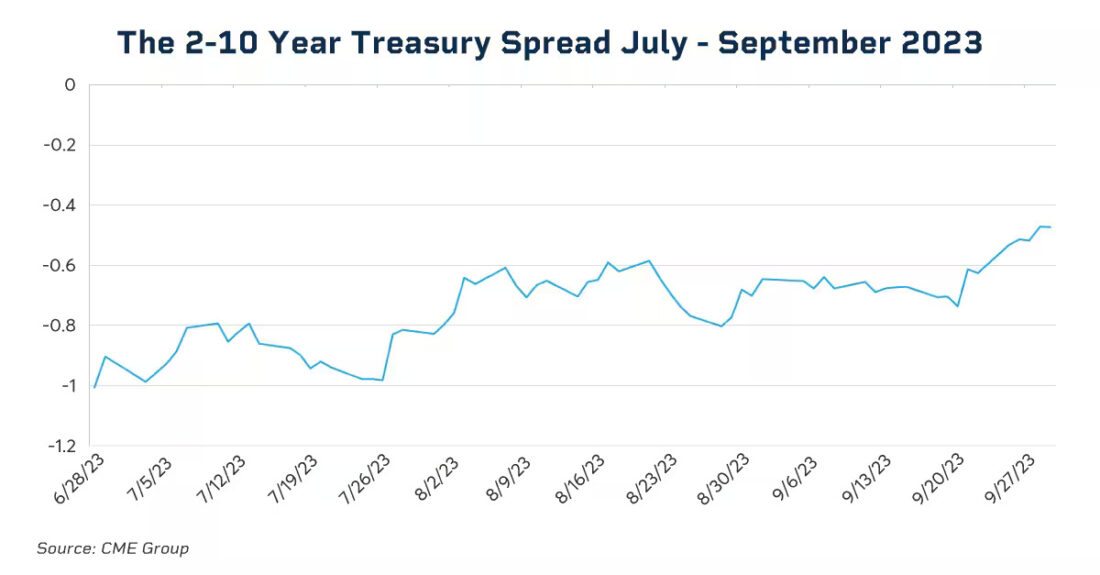
As you can see, based on CVOL skew levels, the options market began pricing in a move toward a “less steep” inversion of the U.S. Treasury Yield curve in late July. Over the next couple of months, the inversion of the 2s/10s and 2s/30s did, in fact, decline by about 30 basis points.
Then on Oct. 3, the 10-year note yield moved above 4.8%, and the 30-year bond moved above 4.9%, reaching those multi-year highs and flattening the yield curve even more.
To be clear, a skew shift will certainly not always predict a price move in the underlying, and there are many dynamics involved in options pricing. For example, sometimes we see an upward move in implied volatility after a period of depressed levels simply because the market might perceive relatively lower levels as an opportunity to buy “cheaper insurance.” However, the scenario described here is a good example of what can be learned from analyzing options pricing, particularly using the CVOL tool.
Of course, the CVOL tool also represents a source for options traders to explore trading opportunities. With both intraday and historical values available, traders can use it to identify short term changes in volatility, skew and convexity, as well as diversions from historical normal levels, similar to what we’ve seen recently in the treasury market.
—
Originally Posted October 13, 2023 – Tracking Volatility in 10 and 30-Year Treasuries
Disclosure: Interactive Brokers
Information posted on IBKR Campus that is provided by third-parties does NOT constitute a recommendation that you should contract for the services of that third party. Third-party participants who contribute to IBKR Campus are independent of Interactive Brokers and Interactive Brokers does not make any representations or warranties concerning the services offered, their past or future performance, or the accuracy of the information provided by the third party. Past performance is no guarantee of future results.
This material is from CME Group and is being posted with its permission. The views expressed in this material are solely those of the author and/or CME Group and Interactive Brokers is not endorsing or recommending any investment or trading discussed in the material. This material is not and should not be construed as an offer to buy or sell any security. It should not be construed as research or investment advice or a recommendation to buy, sell or hold any security or commodity. This material does not and is not intended to take into account the particular financial conditions, investment objectives or requirements of individual customers. Before acting on this material, you should consider whether it is suitable for your particular circumstances and, as necessary, seek professional advice.
Disclosure: Options Trading
Options involve risk and are not suitable for all investors. Multiple leg strategies, including spreads, will incur multiple commission charges. For more information read the "Characteristics and Risks of Standardized Options" also known as the options disclosure document (ODD) or visit ibkr.com/occ


Join The Conversation
If you have a general question, it may already be covered in our FAQs. If you have an account-specific question or concern, please reach out to Client Services.