


The turn of the year, 2023 into 2024, is just around the corner. As an investor, you may well be wondering what the new year will be like.
In terms of politics, the US presidential elections are approaching. Although the new – or old – president will not be inaugurated until 2025, elections also influence share prices in their run up. This election cycle is in fact known as the four-year cycle.
Contrary to the expectations of many investors, statistically speaking it hardly matters for the stock markets whether a Republican or Democrat is elected. What matters is which year of the four-year election cycle we are in.
So take a look at what the typical election year looks like on the US stock market!
The 4-year cycle influences the markets
The phenomenon known as the 4-year election cycle differentiates according to the year of the presidency. In the 121 years between 1900 and 2020, the Dow Jones rose by an average of 5.89% if it was a presidential election year. In pre-election years, it performed even better at 9.03%. In post-election years, on the other hand, it rose by just 4.54%, and in the following mid-term election years by just 1.36%.
The 4-year election cycle in detail
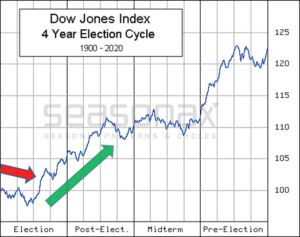
But what does the development look like in detail? Take a look at the average four-year performance of the Dow Jones in the chart. This allows you to take a closer look at developments within the cycle. The scale on the right shows gains as a percentage. The scale at the bottom indicates the specific year of the four-year cycle.
Above “Election” the average course of all election years is shown; above “Post-Election” that of all post-election years; above “Midterm” that of all mid-term election years; and above “Pre-Election” that of all pre-election years.
The chart thus communicates the average trend over all four years.
Dow Jones, 4-year cycle, calculated over 121 years

The election year gets off to a weak start. Source: Seasonax
Now pay attention to the left quarter of the chart. This shows the typical performance of the Dow Jones in election years.
As indicated by the red arrow, these typically posted losses in the first half of the year. After that, things look much better, as indicated by the green arrow.
2024 is now an election year. The election cycle suggests a weak first half of the year, and a good second half.
But, how can you analyse the election cycle yourself with Seasonax?
How to use the filter function on Seasonax
To do this, call up the filter function in Seasonax under “More” on the right above the chart.
There you can display the average course of the election years by selecting the “Election” filter.
Filter function
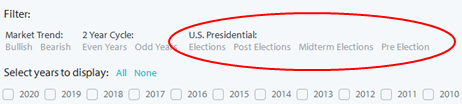
One click to the election cycle. Source: Seasonax
Then you can see the average performance of your favorite share, gold, or the euro, in the election year.
You can of course also look at other years in the four-year cycle, or use different filters such as even/odd years.
Seasonax supports you in a variety of ways with your investment!
As you can see, Seasonax not only allows you to view seasonal charts, but also events such as the election cycle.
Take advantage of this variety from wwww.seasonax.com!
—
Originally Posted December 13, 2023 – 4-Year Election Cycle: How will 2024 go?
Disclosure: Seasonax
Past results and past seasonal patterns are no indication of future performance, in particular, future market trends. Seasonax GmbH neither recommends nor approves of any particular financial instrument, group of securities, segment of industry, analysis interval or any particular idea, approach, strategy or attitude nor provides consulting nor brokerage nor asset management services. Seasonax GmbH hereby excludes any explicit or implied trading recommendation, in particular, any promise, implication or guarantee that profits are earned and losses excluded, provided, however, that in case of doubt, these terms shall be interpreted in abroad sense. Any information provided by Seasonax GmbH or on this website or any other kind of data media shall not be construed as any kind of guarantee, warranty or representation, in particular as set forth in a prospectus. Any user is solely responsible for the results or the trading strategy that is created, developed or applied. Indicators, trading strategies and functions provided by seasonax GmbH or on this website or any other kind of data media may contain logical or other errors leading to unexpected results, faulty trading signals and/or substantial losses. Seasonax GmbH neither warrants nor guarantees the accuracy, completeness, quality, adequacy or content of the information provided by it or on this website or any other kind of data media. Any user is obligated to comply with any applicable capital market rules of the applicable jurisdiction. All published content and images on this website or any other kind of data media are protected by copyright. Any duplication, processing, distribution or any form of utilisation beyond the scope of copyright law shall require the prior written consent of the author or authors in question. Futures and forex trading contains substantial risk and is not for every investor. An investor could potentially lose all or more than the initial investment. Risk capital is money that can be lost without jeopardizing ones’ financial security or lifestyle. Only risk capital should be used for trading and only those with sufficient risk capital should consider trading. Past performance is not necessarily indicative of future results. Testimonials appearing on this website may not be representative of other clients or customers and is not a guarantee of future performance or success.
Disclosure: Interactive Brokers
Information posted on IBKR Campus that is provided by third-parties does NOT constitute a recommendation that you should contract for the services of that third party. Third-party participants who contribute to IBKR Campus are independent of Interactive Brokers and Interactive Brokers does not make any representations or warranties concerning the services offered, their past or future performance, or the accuracy of the information provided by the third party. Past performance is no guarantee of future results.
This material is from Seasonax and is being posted with its permission. The views expressed in this material are solely those of the author and/or Seasonax and Interactive Brokers is not endorsing or recommending any investment or trading discussed in the material. This material is not and should not be construed as an offer to buy or sell any security. It should not be construed as research or investment advice or a recommendation to buy, sell or hold any security or commodity. This material does not and is not intended to take into account the particular financial conditions, investment objectives or requirements of individual customers. Before acting on this material, you should consider whether it is suitable for your particular circumstances and, as necessary, seek professional advice.


Join The Conversation
If you have a general question, it may already be covered in our FAQs. If you have an account-specific question or concern, please reach out to Client Services.