Tomorrow is the first Friday of December, which means the Bureau of Labor Statistics (BLS) will be releasing their payrolls and unemployment report for November. This is an important release at any time, but tomorrow’s report arrives less than two weeks ahead of an FOMC meeting where a speedier taper and more aggressive rate guidance are likely to be under consideration. Chair Powell has indicated a bit more nervousness about inflation, and reports of a robust labor market could accelerate the Federal Reserve’s move away from monetary stimulus.
Yesterday we received our first clue about the labor market from the ADP Employment Change report. Amidst the gyrations in the stock and bond markets, the in-line report was largely ignored. We saw growth in November employment of 534,000 vs expectations of 525,000, with a negligible adjustment of +1,000 to October’s report. The report was taken in stride, as equity futures were rallying strongly after Tuesday’s drop, and largely ignored as major US indices gave back their early gains and plunged in the afternoon.
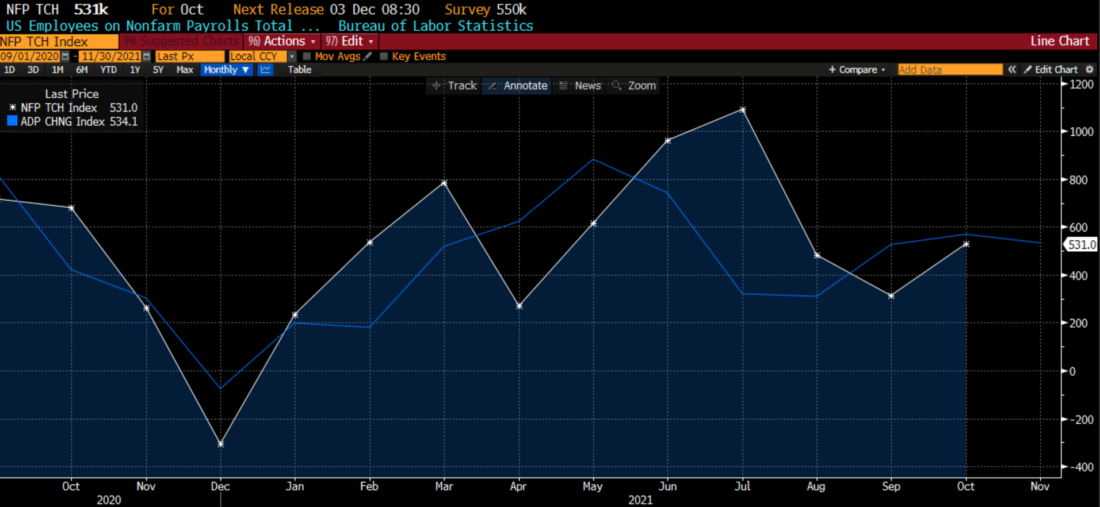
In prior months, we have looked to the ADP report ahead of previous BLS payrolls reports. We believe that ADP is a decent but imperfect predictor of the report released 2 days later, as the following chart shows:
BLS Nonfarm Payrolls (white) vs. ADP Employment Change (blue)

Source: Bloomberg
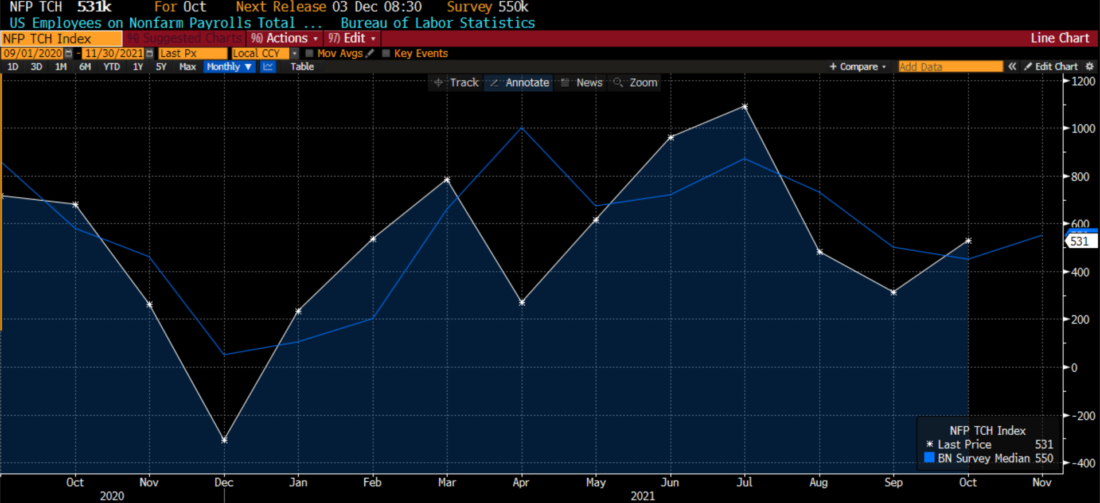
There was a large divergence in the initial September report, but that was largely erased in last month’s revision. It does not appear that there is much to suggest that expectations for the coming report are particularly out of line, as the next graph shows:
BLS Nonfarm Payrolls (white) vs. Economist Survey (blue)


Source: Bloomberg
We see that economists have gotten their payroll estimates largely correct, at least when revisions are factored in. We have no way of knowing what the outcome will be, but it is reasonable to think that the estimates of an increase of 550,000 non-farm payrolls seems reasonable.
Given the markets’ recent bout of volatility, an out of consensus result could prove to be yet another excuse for stock or bond markets to lurch. Tomorrow’s report may prove to be a case where traders are actually hoping for bad news. A stronger than expected report would further kindle fears that the Fed would be more aggressive in tapering purchases and more able to raise rates sooner than hoped, while a weaker result could be perceived as allowing the Fed to extend monetary stimulus more than currently expected.
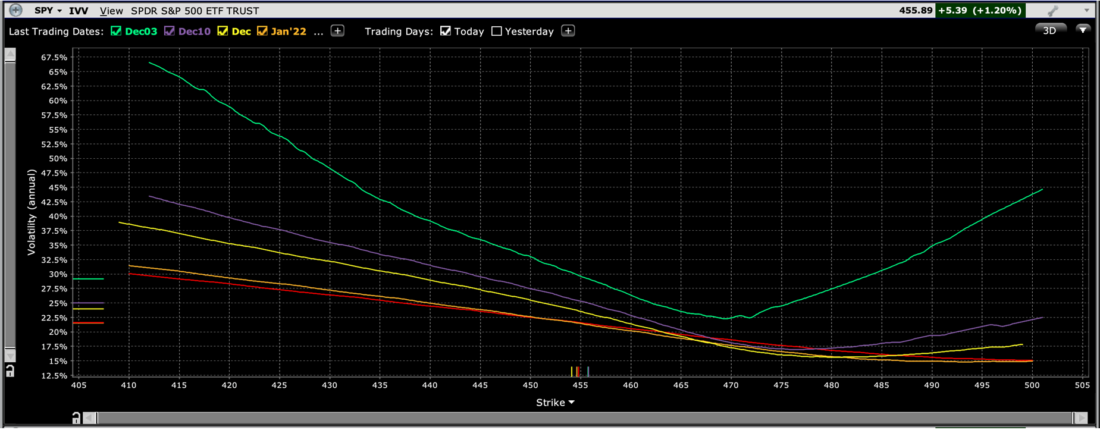
In light of the recent volatility and ahead of yet another market moving event, it is useful to take a quick glance at what options markets might be anticipating as well. The following graph shows multi-expiry skews for the next 2 weekly and 3 monthly SPY options expiries, using the TWS’ IV Viewer + Term Structure function:
SPY Skew for Multiple Experies: Dec 3rd (green), 10th (purple), 17th(yellow), Jan 21st (orange), Feb 18th (red)


The chart displays a significant amount of risk aversion, with out-of-the-money puts trading with implied volatilities well above those of similarly out-of-the-money calls. We also see that the lowest implied volatilities are for options with strikes about 2-5% above the current level for SPY. I find that somewhat interesting, not because markets are bidding up for protective puts – traders typically pay more for hedges after a dip than before – but because they appear reluctant to be betting on a bounce. This can be somewhat explained by the expectation that implied volatilities across the board would be expected to dip if the market bounces significantly, but there does appear to more of a reluctance among SPY traders to buy the dip than one might have thought.
Disclosure: Interactive Brokers
The analysis in this material is provided for information only and is not and should not be construed as an offer to sell or the solicitation of an offer to buy any security. To the extent that this material discusses general market activity, industry or sector trends or other broad-based economic or political conditions, it should not be construed as research or investment advice. To the extent that it includes references to specific securities, commodities, currencies, or other instruments, those references do not constitute a recommendation by IBKR to buy, sell or hold such investments. This material does not and is not intended to take into account the particular financial conditions, investment objectives or requirements of individual customers. Before acting on this material, you should consider whether it is suitable for your particular circumstances and, as necessary, seek professional advice.
The views and opinions expressed herein are those of the author and do not necessarily reflect the views of Interactive Brokers, its affiliates, or its employees.
Disclosure: Options Trading
Options involve risk and are not suitable for all investors. Multiple leg strategies, including spreads, will incur multiple commission charges. For more information read the "Characteristics and Risks of Standardized Options" also known as the options disclosure document (ODD) or visit ibkr.com/occ
Disclosure: Futures Trading
Futures are not suitable for all investors. The amount you may lose may be greater than your initial investment. Before trading futures, please read the CFTC Risk Disclosure. A copy and additional information are available at ibkr.com.


