1/ DXY Flat; Commodities and Equities Rise
2/ Equities Overextended
3/ Precious Metals Stage a Major Breakout
4/ GLD breaks out; Shows Improvement in Relative Momentum
Investopedia is partnering with CMT Association on this newsletter. The contents of this newsletter are for informational and educational purposes only, however, and do not constitute investing advice. The guest authors, which may sell research to investors, and may trade or hold positions in securities mentioned herein do not represent the views of CMT Association or Investopedia. Please consult a financial advisor for investment recommendations and services.
1/ DXY Flat; Commodities and Equities Rise
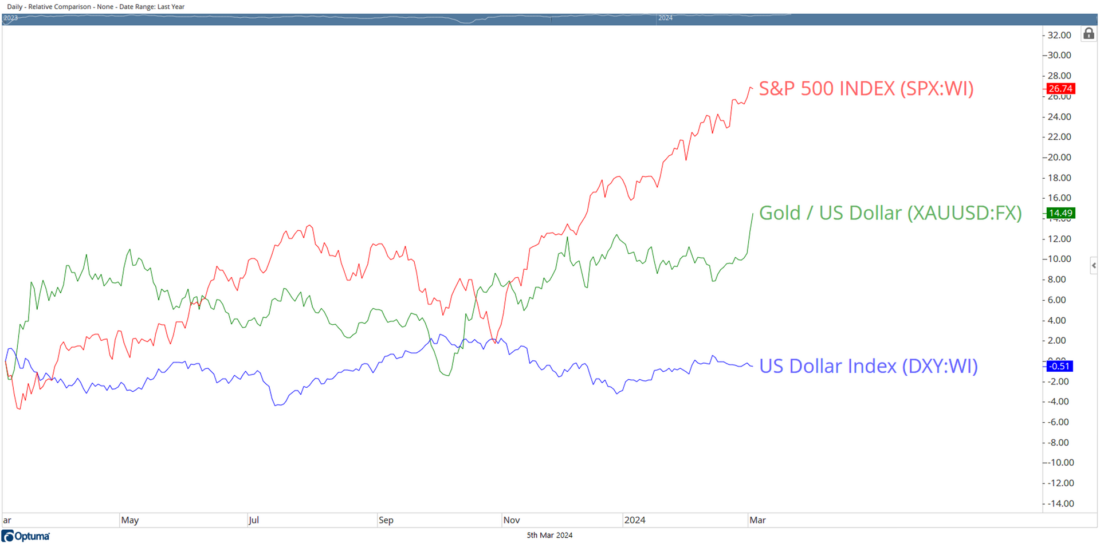
Going by the rules of Intermarket analysis and the set relation between currencies and commodities, a weak US Dollar generally aids commodities like Gold. However, over the past twelve months, DXY hasn’t changed much; it has stayed flat, and yet Gold has strengthened based on pure technicals. The Relative Comparison of Gold, Equities (represented by the S&P 500 Index), and the US Dollar Index shows that the DXY has stayed flat; it has lost just 0.51% over the past year. However, Gold (XAUUSD) gained 14.49% annually while Equities returned a whopping 26% over the same period, i.e., past twelve months.
2/ Equities Overextended
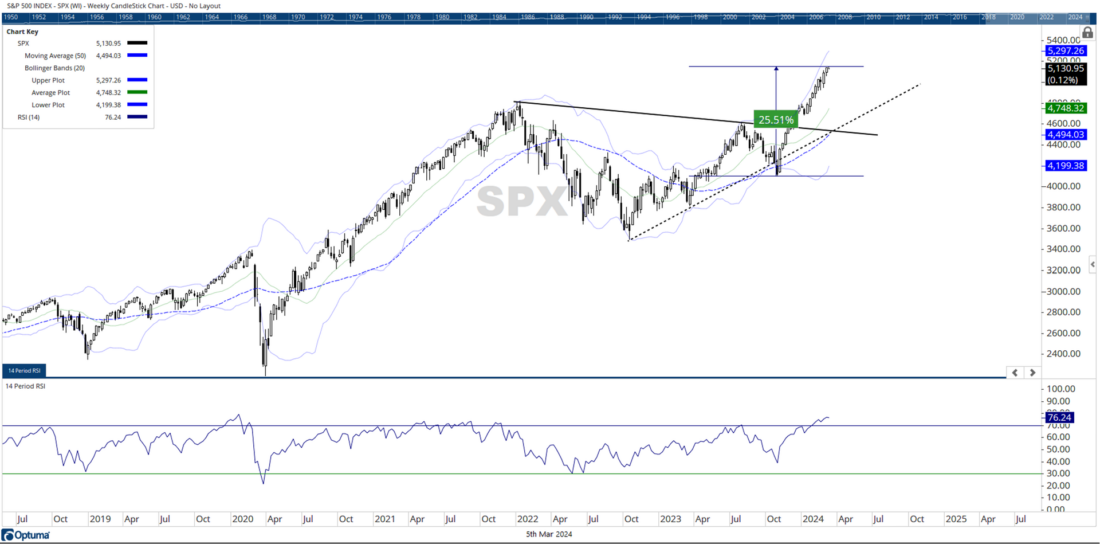

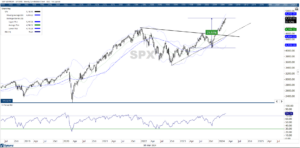
Taking the Relative Comparison further, let us zoom in on Equities. The S&P 500 Index may have gained over 26% over the past twelve months. However, all those gains have come in just the last six months. From the most recent lows of 4103 seen in October last year, this broad market Index has gained over 25.51% over just the last five months.
This one-way parabolic rise has seen the Bollinger bands getting wider beyond normal and has created a bulge. This bulge has the potential to kill this trend, or at least halt the trend and push the equities under some consolidation.
Also, there is a serious deviation from the mean. The 50-week MA is currently at 4494, which is 14% below current S&P 500 levels. This makes some room for mean reversion as well.
3/ Precious Metals Stage a Major Breakout
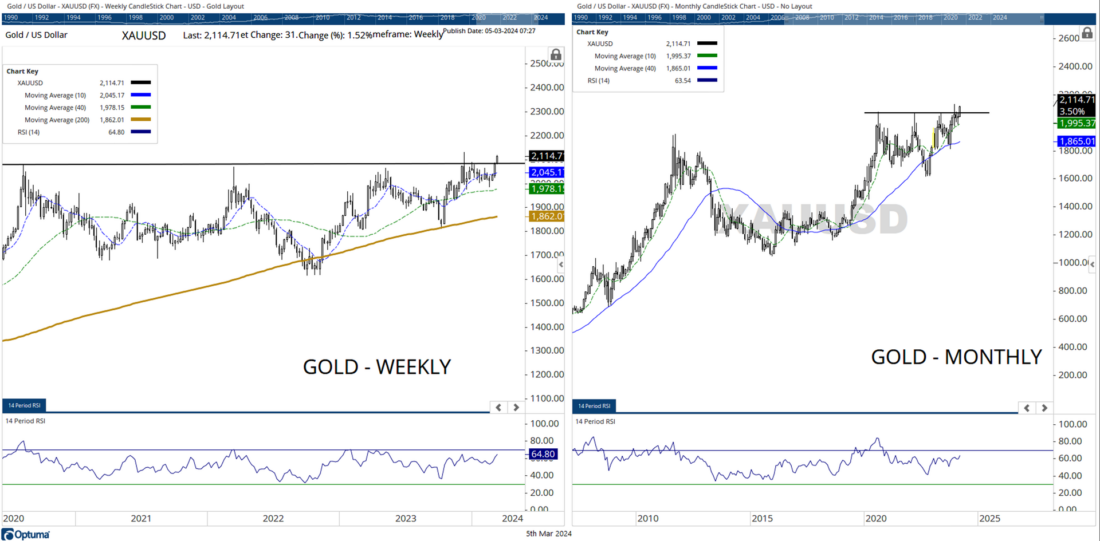

Gold (XAUUSD) has staged a major breakout on major time frames. It shows a strong thrust on both weekly as well as monthly charts. Though the bar on each of these timeframes is incomplete, it makes a solid case for future sure in Gold if the precious commodity keeps its head above 2000-2040 levels.
4/ GLD breaks out; Shows Improvement in Relative Momentum
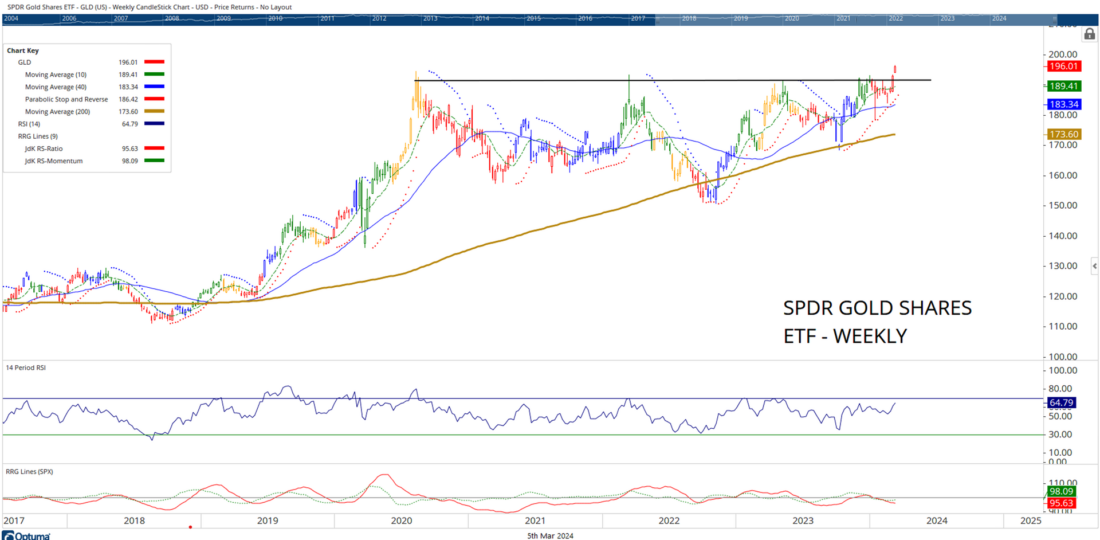

Gold ETF – SPDR Gold Shares ETF (GLD) invites fresh entry opportunities. This ETF has staged a breakout as it crossed above the $ 190 level. The RSI marks a new 14-period high; it stays neutral while not showing any divergence against the price.
Importantly, the chart is plotted with the color of RRG Quadrants while benchmarking the Gold ETF (GLD) against the equities, i.e., the S&P500 index. Even while GLD breaks out, the color of the bar is still red hinting at the placement of GLD in the lagging quadrant.
However, if we look at the trajectory of the tails in the lower pane, it is quite evident that the green line is seen inching higher. This shows that GLD is improving its Relative Momentum against equities; once JdK RS Momentum crosses above 100, it may mean a potential beginning of a phase of relative outperformance of the commodity against the equities.
———–
Originally posted on March 5th 2024
Disclosure: Investopedia
Investopedia.com: The comments, opinions and analyses expressed herein are for informational purposes only and should not be considered individual investment advice or recommendations to invest in any security or to adopt any investment strategy. While we believe the information provided herein is reliable, we do not warrant its accuracy or completeness. The views and strategies described on our content may not be suitable for all investors. Because market and economic conditions are subject to rapid change, all comments, opinions and analyses contained within our content are rendered as of the date of the posting and may change without notice. The material is not intended as a complete analysis of every material fact regarding any country, region, market, industry, investment or strategy. This information is intended for US residents only.
Disclosure: Interactive Brokers
Information posted on IBKR Campus that is provided by third-parties does NOT constitute a recommendation that you should contract for the services of that third party. Third-party participants who contribute to IBKR Campus are independent of Interactive Brokers and Interactive Brokers does not make any representations or warranties concerning the services offered, their past or future performance, or the accuracy of the information provided by the third party. Past performance is no guarantee of future results.
This material is from Investopedia and is being posted with its permission. The views expressed in this material are solely those of the author and/or Investopedia and Interactive Brokers is not endorsing or recommending any investment or trading discussed in the material. This material is not and should not be construed as an offer to buy or sell any security. It should not be construed as research or investment advice or a recommendation to buy, sell or hold any security or commodity. This material does not and is not intended to take into account the particular financial conditions, investment objectives or requirements of individual customers. Before acting on this material, you should consider whether it is suitable for your particular circumstances and, as necessary, seek professional advice.
Disclosure: Forex
There is a substantial risk of loss in foreign exchange trading. The settlement date of foreign exchange trades can vary due to time zone differences and bank holidays. When trading across foreign exchange markets, this may necessitate borrowing funds to settle foreign exchange trades. The interest rate on borrowed funds must be considered when computing the cost of trades across multiple markets.
Disclosure: ETFs
Any discussion or mention of an ETF is not to be construed as recommendation, promotion or solicitation. All investors should review and consider associated investment risks, charges and expenses of the investment company or fund prior to investing. Before acting on this material, you should consider whether it is suitable for your particular circumstances and, as necessary, seek professional advice.




Join The Conversation
If you have a general question, it may already be covered in our FAQs. If you have an account-specific question or concern, please reach out to Client Services.