


Business Cycle Rotation Part 5
Investopedia is partnering with CMT Association on this newsletter. The contents of this newsletter are for informational and educational purposes only, however, and do not constitute investing advice. The guest authors, which may sell research to investors, and may trade or hold positions in securities mentioned herein do not represent the views of CMT Association or Investopedia. Please consult a financial advisor for investment recommendations and services.
Business Cycle Rotation Part 5

In the first four installments we described an exercise utilizing the momentum in asset classes, the relationship between those classes and the Organization for Economic Co-operation and Development (OECD) Composite Leading Indicator (CLI) for the United States, to anticipate the business cycle and markets. In the last installment we discussed the changes from the end of 2022 until October 2023 and interest rates. Those posts are linked below. In this installment we address the macro environment.
Since October when this series was mostly written, several markets have made promising changes in their momentum states and chart patterns. But this is a teaching exercise so we will mostly work with the data available at the end of September 2023 and mostly ignore the dramatic changes of the last few weeks.
It is said that markets are discounting mechanisms, anticipating change in the business cycle. I believe that it is generally true, and while it has been less true for much of the last two decades, it is about to become true again. It is my view that a large portion of the bull market of the last fifteen years is largely an artifact of the liquidity flood that followed the 2008 financial crisis.
Starting in the late 1980s the deflationary forces created by globalization and technological advancements enabled central bank activism and allowed fiscal authorities to run massive deficits without readily apparent repercussions. The willingness of monetary authorities to support asset prices rendered the business cycle mostly benign and economic signals generated by the markets less useful. Bullish trends became longer and more entrenched, dips better supported, overbought conditions persisted longer while oversold conditions were fleeting. Counterproductive trading and investing behaviors and bad analysis were continuously bailed out by policy.
I believe that there has been a shift in the inflation regime following the pandemic and as a result, an enduring shift in monetary policy. Central banks will be more focused on fighting inflation and liquidity, except during episodes of explicit systemic risk, will be far more constrained. As a result, the rates/commodity/equity link will become strong again. At the same time, high debt levels and debt servicing costs will increasingly severely constrain fiscal policy. Generally speaking, more frequent periods of higher inflation and higher debt burdens should result in higher yields and an economy that grows below potential. There will be growth constraints on commodities, and equities whose earnings are constrained by higher rates and inflation.
Markets will become choppier, dips larger, overbought conditions persist for much shorter periods while oversold conditions become more numerous and deeper. Counterproductive trading and investing behaviors and bad analysis will be far less likely to be bailed out by policy.
Importantly, in a more inflationary environment, debt and equity will be mostly positively correlated, mostly rising, and falling in tandem as inflation ebbs and flows and during periods of systemic risk.
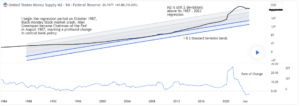
Distortions from massive monetary and fiscal liquidity introduced during and after the pandemic continue to reverberate through and distort markets and growth. I think this is best illustrated by M2 money supply. The bottom panel is the 12 month rate of change. This is the chart that I see used most often to describe liquidity. You can see the extreme M2 expansion during the pandemic and the subsequent sharp contraction. In my view, this represents the “flow” of liquidity. The flow has declined significantly over the last 2 1/2 years and is now negative. This has led many to conclude that the liquidity is constraining both markets and growth. On the other hand, the top panel is M2 regressed from the Black Monday stock market crash in 1987. I think of this as the “stock” of liquidity. Viewed in this manner the ‘stock” is still more than 2 standard deviations above the long term growth line. In my view, changes in “flow” probably do not matter nearly as much when available “stock” is this high. Anecdotally this chart helps explain my general observation over the last year that markets continue to trade as if liquidity remains plentiful.
—
Originally posted 11th January 2024
Disclosure: Investopedia
Investopedia.com: The comments, opinions and analyses expressed herein are for informational purposes only and should not be considered individual investment advice or recommendations to invest in any security or to adopt any investment strategy. While we believe the information provided herein is reliable, we do not warrant its accuracy or completeness. The views and strategies described on our content may not be suitable for all investors. Because market and economic conditions are subject to rapid change, all comments, opinions and analyses contained within our content are rendered as of the date of the posting and may change without notice. The material is not intended as a complete analysis of every material fact regarding any country, region, market, industry, investment or strategy. This information is intended for US residents only.
Disclosure: Interactive Brokers
Information posted on IBKR Campus that is provided by third-parties does NOT constitute a recommendation that you should contract for the services of that third party. Third-party participants who contribute to IBKR Campus are independent of Interactive Brokers and Interactive Brokers does not make any representations or warranties concerning the services offered, their past or future performance, or the accuracy of the information provided by the third party. Past performance is no guarantee of future results.
This material is from Investopedia and is being posted with its permission. The views expressed in this material are solely those of the author and/or Investopedia and Interactive Brokers is not endorsing or recommending any investment or trading discussed in the material. This material is not and should not be construed as an offer to buy or sell any security. It should not be construed as research or investment advice or a recommendation to buy, sell or hold any security or commodity. This material does not and is not intended to take into account the particular financial conditions, investment objectives or requirements of individual customers. Before acting on this material, you should consider whether it is suitable for your particular circumstances and, as necessary, seek professional advice.


Join The Conversation
If you have a general question, it may already be covered in our FAQs. If you have an account-specific question or concern, please reach out to Client Services.