


Investopedia is partnering with CMT Association on this newsletter. The contents of this newsletter are for informational and educational purposes only, however, and do not constitute investing advice. The guest authors, which may sell research to investors, and may trade or hold positions in securities mentioned herein do not represent the views of CMT Association or Investopedia. Please consult a financial advisor for investment recommendations and services.
1/ In Love with the Cocoa
The history of Cocoa Beans goes back thousands of years with roots dating back to the Mayan and Aztec cultures of Central and South America. Once used as a currency, medicine, and a stimulant, today as a society, we have a different use case for chocolate. Modern chocolate was introduced in the late 1800’s and has now become a staple of the American discretionary diet.
Cocoa prices have been climbing due to unfavorable growing conditions in West Africa where up to 70% of the world’s cocoa supply is grown. This has pushed prices to levels not seen since the late 1970’s. Record cocoa prices ahead of Valentine’s Day won’t likely be too impactful in the short term on retail chocolate demand but will likely cause continual retail pricing pressure.
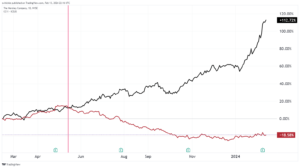
Below is a good visual representation of how skyrocketing commodities can cause headwinds for a company heavily dependent on commodities as an input for production.
Hersey’s (HSY) reported “mixed” earnings last week missing top line while exceeding bottom line Wall Street expectations. The company also guided lower than analyst expectations for full year 2024. However, keep an eye on Cocoa/HSY relationship. One day they may fall back in love instead of growing apart.
Forrest Gump’s mama once said, “Life was like a box of chocolates. You never know what you’re gonna get”. While those are wise words, they are not always true when we have charts that show us what we are going to get. But like Forrest, I am a simple man. In this case, we don’t have to add any special indicators to tell us what is happening here.

2/ Every Rose has Its Thorn
I am writing this piece as a reminder to myself that I need to buy my wife flowers for Valentine’s Day. Let this serve as your reminder also. After doing some research I came across 1-800-Flowers (FLWS). Naturally before placing an order, I am going to look at their chart.
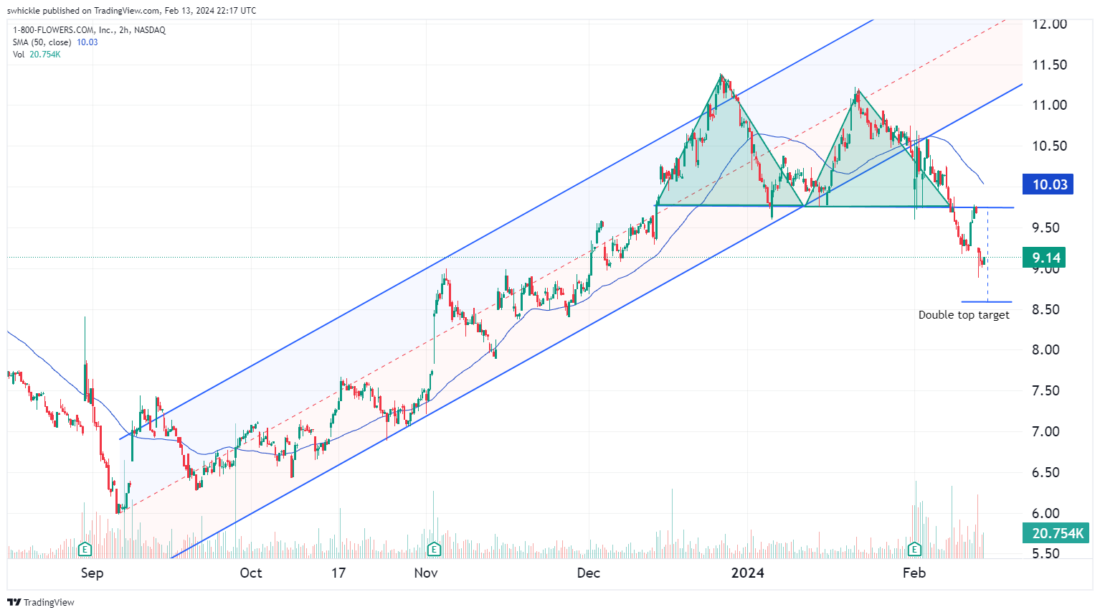
1-800-Flowers is not painting a very rosy picture. We can see the trend was positive but has been breaking down since the beginning of February as it crossed below the 50-day Simple Moving Average (SMA). Right around the same time FLWS was flirting with falling below the Linear Regression Channel. This weakness coincides with a mixed earnings report on February 1st. FLWS beat on the top line but missed on revenue. Wall Street woke up and smelled the roses as heavy selling pressure sent the stock lower.
Another pattern that can help guide our opinion is a confirmed double top chart pattern. This bearish reversal pattern confirms a breakout to the downside with a breakout below the neckline on heavy volume. Trading reversed course after an attempt failed to pierce back above the neckline. FLWS gapped down further, eroding in price. We can use the Measure Principal to formulate a downside target. In this case we take 73% of the highest peak to trough distance and subtract it from the neckline. As we can see FLWS is well on its way. Oops a daisy.
3/ Whatcha doing Sweet Thang
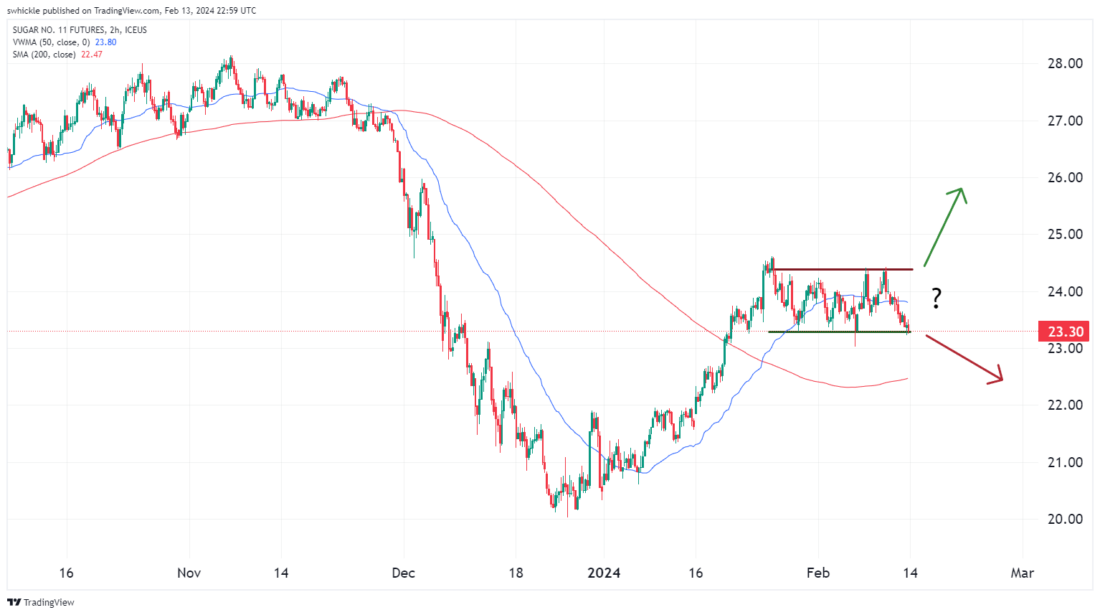
I will keep this one short and sweet. Sugar No. 11, where’s it headed? Let’s first look to see where it has been. Back in November there was sugar high at a little over 28 cents per pound. Coming into December and January those highs were reversed as sugar plummeted to the low of around 20 cents per pound. This represents a near 28% move from peak to trough. Since then, we have retraced almost 50% of the move down.
Now Sugar No. 11 has stalled and has begun trading sideways in a defined trading range known as a “Rectangle” or “Box” pattern. Eventually prices will break below or above the pattern.
Rectangle patterns are plagued with false and or premature breakouts. These are defined as minor breakouts above or below trend that quickly return to the defined range. If a breakout occurs with a gap the odds of a false retracement are reduced. Prices do not always have to touch the support and resistance zone resulting in a “shortfall”. Shortfalls can give us a clue as to the potential directions for a breakout.
As a trader waiting for an opportunity can feel like an eternity. It is important to have discipline and a lot of patience. I have no idea where sugar is going so for this one, we wait and check back periodically to see how the chart plays out as we look for clues to the direction of the eventually breakout.
—
Originally posted February 14th 2024
Disclosure: Investopedia
Investopedia.com: The comments, opinions and analyses expressed herein are for informational purposes only and should not be considered individual investment advice or recommendations to invest in any security or to adopt any investment strategy. While we believe the information provided herein is reliable, we do not warrant its accuracy or completeness. The views and strategies described on our content may not be suitable for all investors. Because market and economic conditions are subject to rapid change, all comments, opinions and analyses contained within our content are rendered as of the date of the posting and may change without notice. The material is not intended as a complete analysis of every material fact regarding any country, region, market, industry, investment or strategy. This information is intended for US residents only.
Disclosure: Interactive Brokers
Information posted on IBKR Campus that is provided by third-parties does NOT constitute a recommendation that you should contract for the services of that third party. Third-party participants who contribute to IBKR Campus are independent of Interactive Brokers and Interactive Brokers does not make any representations or warranties concerning the services offered, their past or future performance, or the accuracy of the information provided by the third party. Past performance is no guarantee of future results.
This material is from Investopedia and is being posted with its permission. The views expressed in this material are solely those of the author and/or Investopedia and Interactive Brokers is not endorsing or recommending any investment or trading discussed in the material. This material is not and should not be construed as an offer to buy or sell any security. It should not be construed as research or investment advice or a recommendation to buy, sell or hold any security or commodity. This material does not and is not intended to take into account the particular financial conditions, investment objectives or requirements of individual customers. Before acting on this material, you should consider whether it is suitable for your particular circumstances and, as necessary, seek professional advice.
Disclosure: Futures Trading
Futures are not suitable for all investors. The amount you may lose may be greater than your initial investment. Before trading futures, please read the CFTC Risk Disclosure. A copy and additional information are available at ibkr.com.


Join The Conversation
If you have a general question, it may already be covered in our FAQs. If you have an account-specific question or concern, please reach out to Client Services.