


1/ A Consolidation Through Time and Not Price for the S&P 500
2/ Four-Week New Lows Are Expanding for the Market of Stocks
3/ Parabolic Moves Do Not Correct Sideways
4/ A Counter-Trend Bounce for the 10-Year Yield
5/ A Steeper Yield Curve is Weighing on Risk Sentiment
6/ Recent Sector Correlations to Yield Curve
Investopedia is partnering with CMT Association on this newsletter. The contents of this newsletter are for informational and educational purposes only, however, and do not constitute investing advice. The guest authors, which may sell research to investors, and may trade or hold positions in securities mentioned herein do not represent the views of CMT Association or Investopedia. Please consult a financial advisor for investment recommendations and services.
1/ A Consolidation Through Time and Not Price for the S&P 500

Our view has been that January’s pullback in the S&P 500 or the “stock market” is consistent with how good overbought conditions typically resolve and have inflicted little damage to the prevailing uptrend. Overbought conditions can be resolved in one of two ways: through a decline in price, often a 1/3 – 2/3 retracement of the preceding move higher, or through the passage of time via sideways trading. Hesitation under all-time high resistance shouldn’t be too surprising, especially as the market looks for confirmation of a Fed pivot as well as earnings season. Based purely on the chart itself (see chart 1), one can’t get too worried on this side of 4700 support or even 4600. In order to remove our +5,000 upside objective, a 43-handle will be needed, and it is way too soon to entertain that. But as we experienced over the past two years, there is a big difference between the “stock market” and the “market of stocks,” which is influenced by the macro environment.
2/ Four-Week New Lows Are Expanding for the Market of Stocks

While the “stock market” consolidates through time, the “market of stocks” does not. As chart 2 shows, the percentage of four-week lows has expanded to approx. 40% for the Russell 3000 Index (see chart 3). This is an elevated reading, considering that the index is not at a four-week low and is the weakest reading since October. Bottom line, the S&P 500 is masking weakness beneath the surface.
3/ Parabolic Moves Do Not Correct Sideways

The tricky part since the beginning of the year has been navigating the consolidation phase. Outside of Small Caps, most stocks are consolidating sideways through time and not meaningfully lower via price. The risk, however, is that we are about to commence on a sharp retracement of the October recovery, which is supported by overly bullish sentiment, market cycles, and the 1999 analog, which suggests a proper correction into February, is following that script nearly perfectly. To that end, a deeper retracement will be signaled on a break of 4700, which will open the doors for a move not only to 4600 but a 1/3 retracement to the 4500 area.
4/ A Counter-Trend Bounce for the 10-Year Yield

One of Bob Farrell’s trading rules states, “Exponential rapidly rising or falling markets usually go further than you think, but they do not correct by going sideways.” The Q4 rally in stocks was an example, especially the 27% gain in small caps over trading 40 days. Therefore, a sideways pause is unlikely. We have been of the view that a pullback to the $185/$190 area would be consistent with a healthy pullback on IWM. In January, trading evolved into a classic ABC type of decline, which tracks to $185 and is approximately where the 50 DMA resides (see chart 4). So long as said support holds, one can continue to look higher, potentially as high as $215, before a prolonged shakeout occurs. Otherwise, $177 or a 61.8% retracement is likely unfolding.
5/ A Steeper Yield Curve is Weighing on Risk Sentiment

With the 10-year moving higher, we have the 2/10 curve at the steepest level since Halloween. A key technical theme of ours this year is whether the “momentum buy” signal on the monthly charts will lead to the curve turning positive and the impact it will have on risk sentiment. Turning the curve positive has led to higher stock values looking out one year later, but the degree to which it steepens becomes problematic. In the past, 40bps or more have been associated with equity market corrections/bear markets and a recession. We are nowhere near that, but folks are starting to alter positioning.
6/ Recent Sector Correlations to Yield Curve
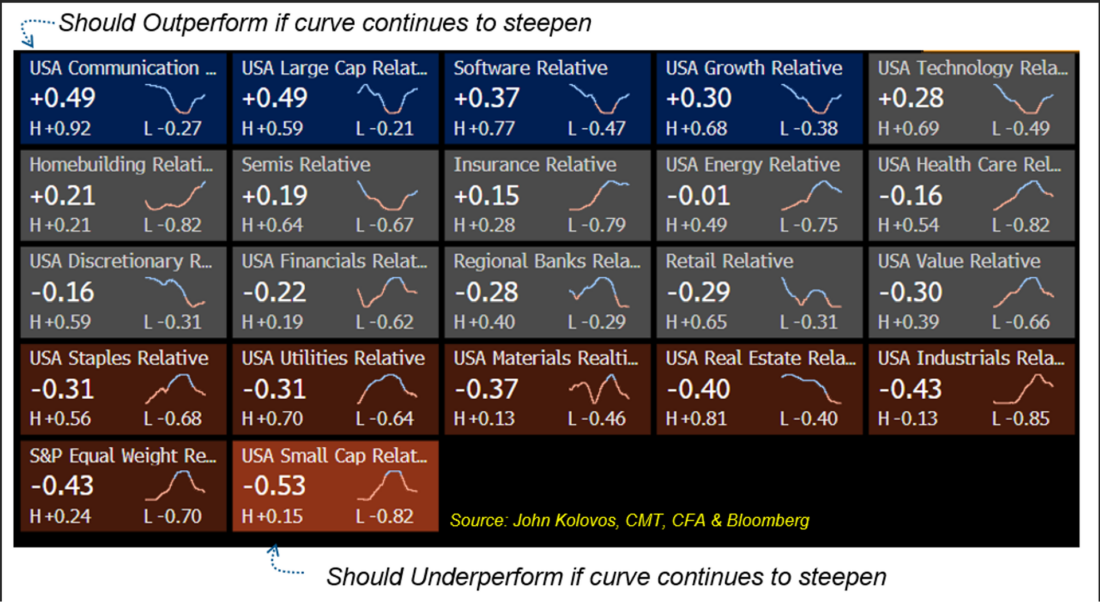
Recent correlations suggest that a steeper curve should act as a headwind for Small Caps and the average stocks (RSP), Industrials, Real Estate, Materials, and Utilities while favoring Communication, Large Caps, Software, and Growth. So, while the S&P 500 is currently consolidating sideways through time, the macro environment is back to weighing on the market of stocks.
—
Originally posted 17th January 2024
Disclosure: Investopedia
Investopedia.com: The comments, opinions and analyses expressed herein are for informational purposes only and should not be considered individual investment advice or recommendations to invest in any security or to adopt any investment strategy. While we believe the information provided herein is reliable, we do not warrant its accuracy or completeness. The views and strategies described on our content may not be suitable for all investors. Because market and economic conditions are subject to rapid change, all comments, opinions and analyses contained within our content are rendered as of the date of the posting and may change without notice. The material is not intended as a complete analysis of every material fact regarding any country, region, market, industry, investment or strategy. This information is intended for US residents only.
Disclosure: Interactive Brokers
Information posted on IBKR Campus that is provided by third-parties does NOT constitute a recommendation that you should contract for the services of that third party. Third-party participants who contribute to IBKR Campus are independent of Interactive Brokers and Interactive Brokers does not make any representations or warranties concerning the services offered, their past or future performance, or the accuracy of the information provided by the third party. Past performance is no guarantee of future results.
This material is from Investopedia and is being posted with its permission. The views expressed in this material are solely those of the author and/or Investopedia and Interactive Brokers is not endorsing or recommending any investment or trading discussed in the material. This material is not and should not be construed as an offer to buy or sell any security. It should not be construed as research or investment advice or a recommendation to buy, sell or hold any security or commodity. This material does not and is not intended to take into account the particular financial conditions, investment objectives or requirements of individual customers. Before acting on this material, you should consider whether it is suitable for your particular circumstances and, as necessary, seek professional advice.
Disclosure: ETFs
Any discussion or mention of an ETF is not to be construed as recommendation, promotion or solicitation. All investors should review and consider associated investment risks, charges and expenses of the investment company or fund prior to investing. Before acting on this material, you should consider whether it is suitable for your particular circumstances and, as necessary, seek professional advice.


Join The Conversation
If you have a general question, it may already be covered in our FAQs. If you have an account-specific question or concern, please reach out to Client Services.