


1/ The S&P 500 Remains Very Vulnerable Below 4694
2/ Investor Asset Flows: S&P 500 (SPY)
3/ Market Internals: The Asbury 6 (A6)
4/ Market Breadth: % Of NYSE Composite Stocks Trading Above Their 40-day Moving Average
5/ Standard Deviation: NYSE Stocks
Investopedia is partnering with CMT Association on this newsletter. The contents of this newsletter are for informational and educational purposes only, however, and do not constitute investing advice. The guest authors, which may sell research to investors, and may trade or hold positions in securities mentioned herein do not represent the views of CMT Association or Investopedia. Please consult a financial advisor for investment recommendations and services.
1/ The S&P 500 Remains Very Vulnerable Below 4694

Conclusion, Investment Implications, Strategy
This week, the Tactical (monthly) portion of Table 1 below retains the Positive distribution of key near-term market factors for the US stock market that, for the most part, has been in effect since November — but just barely. Meanwhile, the Strategic (quarterly) portion of the table retains the previous two weeks’ slightly Negative alignment of key intermediate-term market factors, from the Positive one that had existed for the prior two months.
The key theme this week is that this is a very important Tactical and Strategic decision point for the benchmark S&P 500 (SPX), from which it’s next one to several month directional move — either up or down — is likely to begin. Our analysis favors a downside resolution from at or near formidable overhead resistance at 4819, which is the January 2022 all-time high, due to current extremes in market breadth, standard deviation, recently declining assets in the ProShares Ultra S&P500 (SSO), subtly rising market volatility, and additional metrics not shown here including investor sentiment and seasonality,
Tactically, it would take a sustained decline below SPX 4694 on declining volume and a Negative/Risk Off shift in our Tactical models (Asbury 6, Correction Protection Model) to indicate the corrective decline the US stock market is overdue for is underway. Until then, the current October 2023 uptrend is still in charge.
2/ Investor Asset Flows: S&P 500 (SPY)

The lower panel of this chart shows that, through Jan 8th, the total net assets invested in the SPDR S&P 500 ETF Trust (SPY) expanded by $29 billion or 6.4% since Dec 14th. The green highlights in the upper panel show that the lowest price that SPX has traded since then is 4694 — actually six times out of the past 17 days to indicate the market “sees” it and recognizes its importance.
A decline below 4694 would put all of this newly-added AUM in SPY into the red, which could trigger a deeper and more aggressive decline.
3/ Market Internals: The Asbury 6 (A6)

This table shows that, through January 8th, five of the Asbury 6 constituent metrics remain positive (green). The Asbury 6 Risk Management Model itself has been on a Positive tactical bias since Nov 2nd while the S&P 500 has risen by as much as 11% since then.
Four or more metrics in one direction, either Positive (green) or Negative (red), indicate a tactical bias. The dates in each cell indicate when each individual constituent of the “A6” turned either positive (green) or negative (red). When all Asbury 6 constituent metrics are positive, market internals are the most conducive to adding risk to portfolios. Each negative reading adds an additional element of risk to participating in current or new investment ideas.
4/ Market Breadth: % Of NYSE Composite Stocks Trading Above Their 40-day Moving Average

The red highlights in this chart show that the percentage of NYSE Stocks trading above their 40-day moving average is currently declining from a multi-year strong extreme of 71% or higher (lower panel) that, as a contrary indicator, has coincided with or closely led every significant peak in the S&P 500 (upper panel) since 2021 — in major uptrends and major downtrends alike.
5/ Standard Deviation: NYSE Stocks
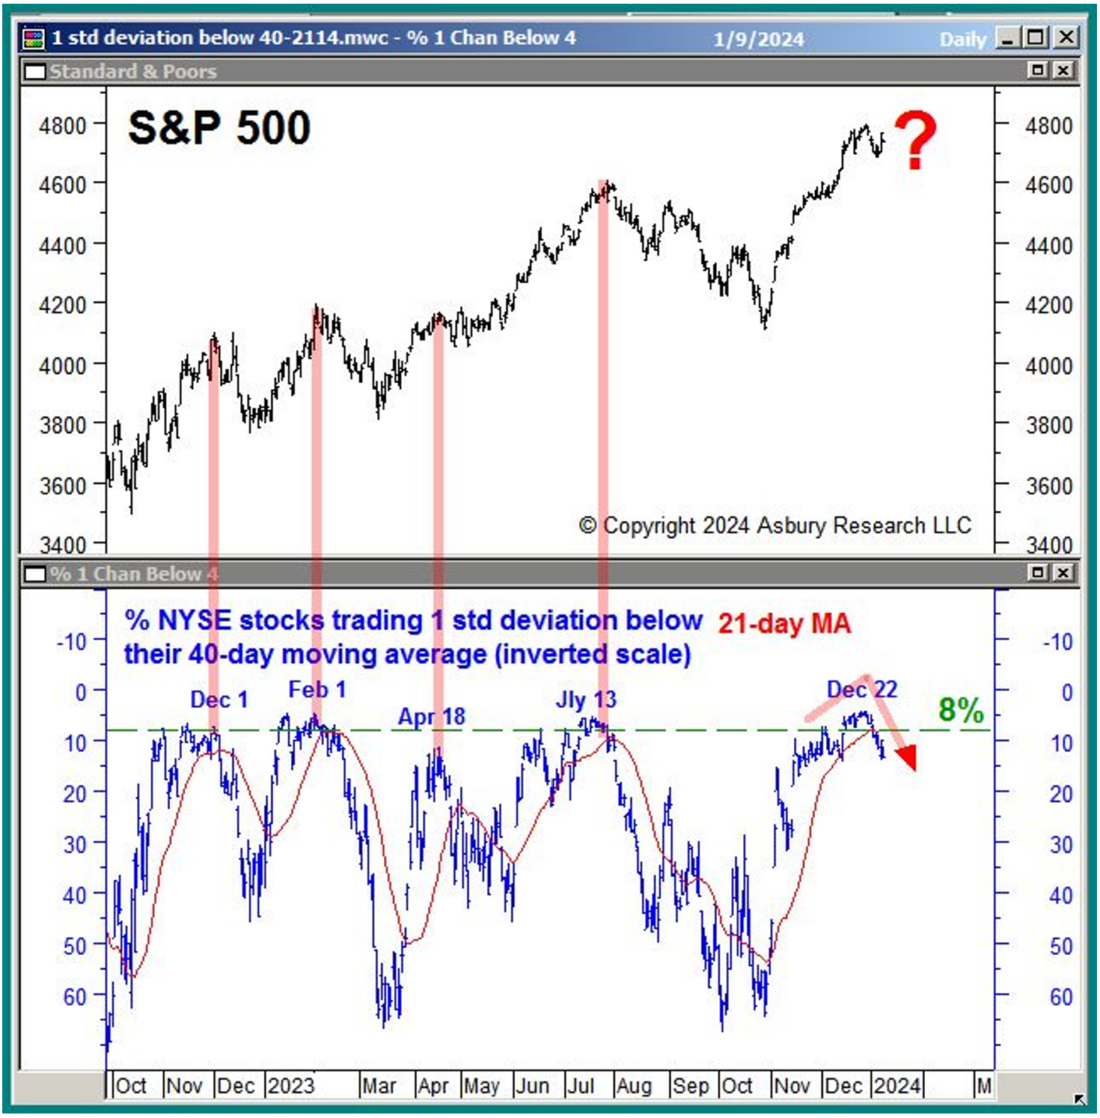
The red highlights in this chart show that the percentage of NYSE stocks trading one standard deviation below their 40-day MA (inverted scale) is reversing from a low extreme of 8% or less that has previously coincided with or closely led every significant peak in the S&P 500 (upper panel) since 2022.
—
Originally posted 10th January 2024
Join The Conversation
If you have a general question, it may already be covered in our FAQs. If you have an account-specific question or concern, please reach out to Client Services.
Leave a Reply
Disclosure: Investopedia
Investopedia.com: The comments, opinions and analyses expressed herein are for informational purposes only and should not be considered individual investment advice or recommendations to invest in any security or to adopt any investment strategy. While we believe the information provided herein is reliable, we do not warrant its accuracy or completeness. The views and strategies described on our content may not be suitable for all investors. Because market and economic conditions are subject to rapid change, all comments, opinions and analyses contained within our content are rendered as of the date of the posting and may change without notice. The material is not intended as a complete analysis of every material fact regarding any country, region, market, industry, investment or strategy. This information is intended for US residents only.
Disclosure: Interactive Brokers
Information posted on IBKR Campus that is provided by third-parties does NOT constitute a recommendation that you should contract for the services of that third party. Third-party participants who contribute to IBKR Campus are independent of Interactive Brokers and Interactive Brokers does not make any representations or warranties concerning the services offered, their past or future performance, or the accuracy of the information provided by the third party. Past performance is no guarantee of future results.
This material is from Investopedia and is being posted with its permission. The views expressed in this material are solely those of the author and/or Investopedia and Interactive Brokers is not endorsing or recommending any investment or trading discussed in the material. This material is not and should not be construed as an offer to buy or sell any security. It should not be construed as research or investment advice or a recommendation to buy, sell or hold any security or commodity. This material does not and is not intended to take into account the particular financial conditions, investment objectives or requirements of individual customers. Before acting on this material, you should consider whether it is suitable for your particular circumstances and, as necessary, seek professional advice.
Disclosure: ETFs
Any discussion or mention of an ETF is not to be construed as recommendation, promotion or solicitation. All investors should review and consider associated investment risks, charges and expenses of the investment company or fund prior to investing. Before acting on this material, you should consider whether it is suitable for your particular circumstances and, as necessary, seek professional advice.


I particularly like the last chart – % trading one standard deviation below their 40-day moving average. That 8% level you mention is very intriguing.
Thanks!
We hope you continue to enjoy IBKR Campus!