


1/ Looking Underneath the Surface
2/ Volatility Increase
3/ Micro Caps Breaks Down
4/ Not Everything is Bad
Investopedia is partnering with CMT Association on this newsletter. The contents of this newsletter are for informational and educational purposes only, however, and do not constitute investing advice. The guest authors, which may sell research to investors, and may trade or hold positions in securities mentioned herein do not represent the views of CMT Association or Investopedia. Please consult a financial advisor for investment recommendations and services.
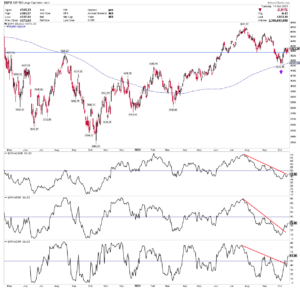
1/Looking Underneath the Surface
The 200-day moving average bounce at the beginning of October could not close the bearish gap that occurred on September 20th. Price has now turned south again, crossing below the 4350 level, which was a former resistance.
One signal that helps explain why this bounce was not very strong is by observing market internals.
The percentage of index participants remaining above the 200-day, 50-day, and 20-day moving averages is currently below 50% and trending downward.
Bulls want to see broadening participation to reassert control. Until then, the bias is sideways, at best.
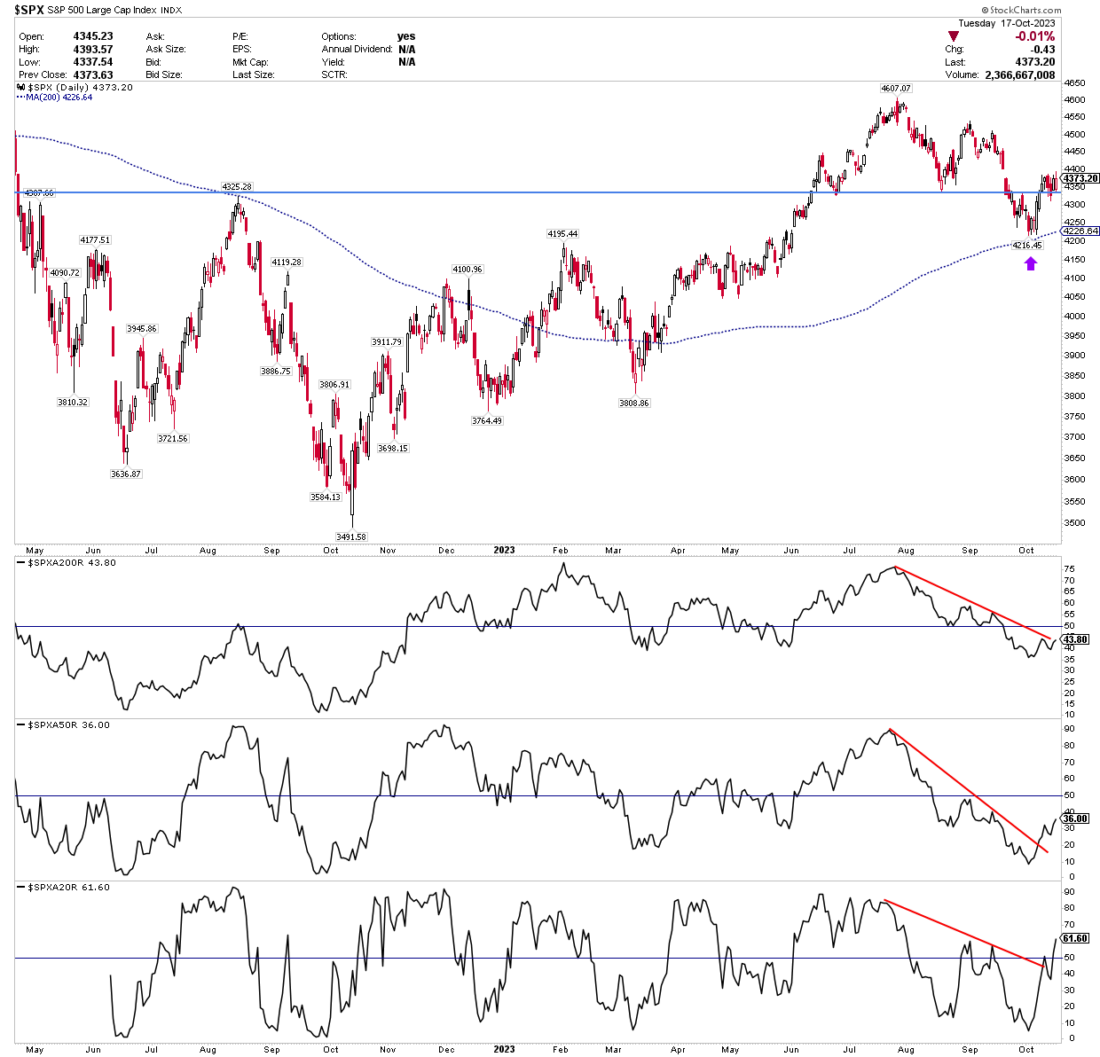
2/ Volatility Increase
The VIX Index has been increasing since the middle of September, breaking out a downward-sloping trendline to close at almost 20 points.
This indicates a certain amount of volatility but nothing extreme yet. The market needs the volatility to remain under this level to reduce the likelihood of increased selling pressure.
This chart shows the inverse relationship between the VIX and the S&P 500 – when the VIX goes up, the price of the S&P 500 usually goes down. Remember that the VIX is often referred to as the market’s “fear index or fear gauge”.
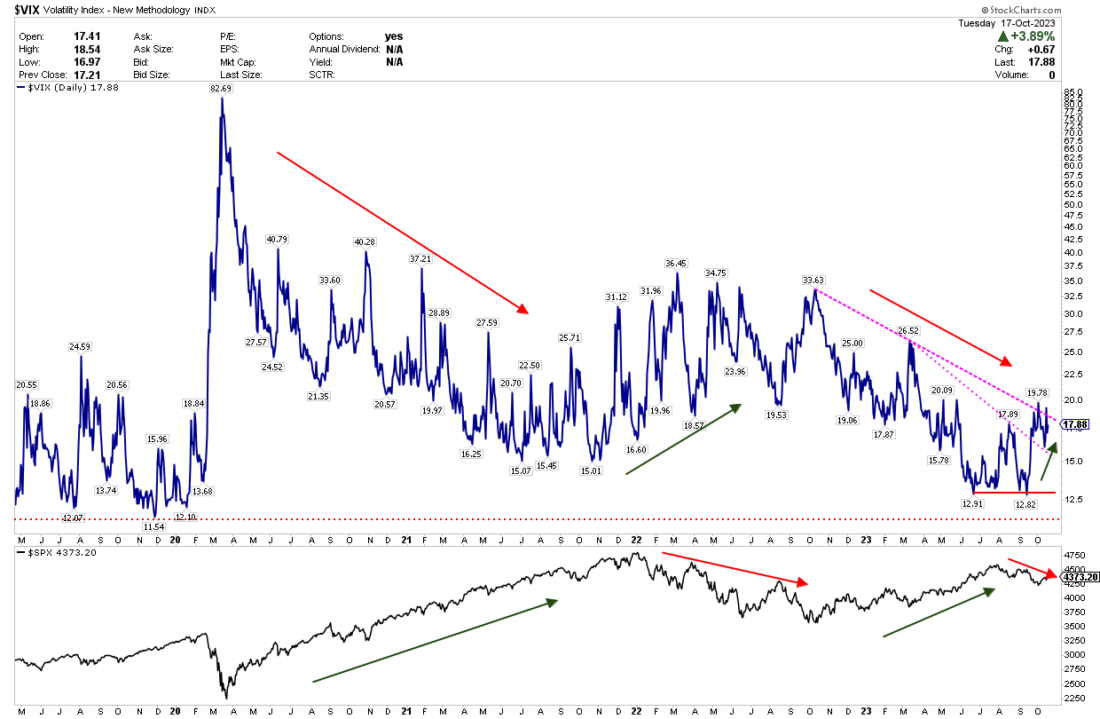
3/ Micro Caps Breaks Down
Another indication of weakness in the internal market can be observed in the small-cap index, represented by the IWC ETF. It has had a challenging year, consistently lagging behind in every minor market rally. In fact, IWC has reached its lowest level in roughly three years.
As you can see, price has finally broken below a support area that had been tested multiple times.
Notably, below this level, there appears to be no significant support until the price range between 88 and 81 points, which coincides with the area of highest trading volume. If this scenario unfolds with a downward resolution, there is a higher likelihood that the broader market will face increased selling pressure.
4/ Not Everything is Bad
Despite the prevailing pessimism in the market and the presence of some signals that lack full robustness, it’s not all doom and gloom. One positive aspect is that the Discretionary Sector is consistently recording higher lows when compared to the Consumer Staples sector.
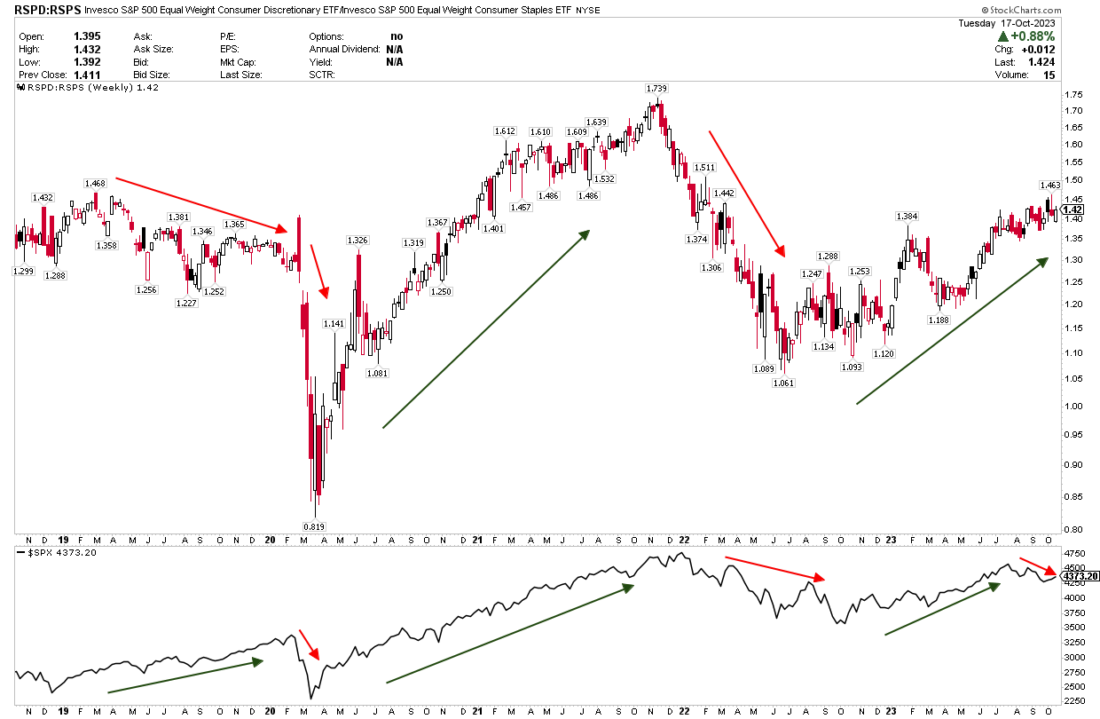
This has proven to be one of the most reliable indicators for assessing the health of a bull market.
When consumer discretionary stocks (representing things we want) outperform consumer staples (representing things we need), it signifies that the market is not adopting a defensive stance.
We have used the Equally Weighted Index chart to gain a more comprehensive perspective.
This tells us that despite the recent pullback in the SPX, the ratio continues to reach new highs.
This situation contrasts with the prelude to the 2020 downturn when the index was not keeping pace with the market’s ascent and was already signaling a more defensive posture.
—
Originally posted 16th October 2023
Disclosure: Investopedia
Investopedia.com: The comments, opinions and analyses expressed herein are for informational purposes only and should not be considered individual investment advice or recommendations to invest in any security or to adopt any investment strategy. While we believe the information provided herein is reliable, we do not warrant its accuracy or completeness. The views and strategies described on our content may not be suitable for all investors. Because market and economic conditions are subject to rapid change, all comments, opinions and analyses contained within our content are rendered as of the date of the posting and may change without notice. The material is not intended as a complete analysis of every material fact regarding any country, region, market, industry, investment or strategy. This information is intended for US residents only.
Disclosure: Interactive Brokers
Information posted on IBKR Campus that is provided by third-parties does NOT constitute a recommendation that you should contract for the services of that third party. Third-party participants who contribute to IBKR Campus are independent of Interactive Brokers and Interactive Brokers does not make any representations or warranties concerning the services offered, their past or future performance, or the accuracy of the information provided by the third party. Past performance is no guarantee of future results.
This material is from Investopedia and is being posted with its permission. The views expressed in this material are solely those of the author and/or Investopedia and Interactive Brokers is not endorsing or recommending any investment or trading discussed in the material. This material is not and should not be construed as an offer to buy or sell any security. It should not be construed as research or investment advice or a recommendation to buy, sell or hold any security or commodity. This material does not and is not intended to take into account the particular financial conditions, investment objectives or requirements of individual customers. Before acting on this material, you should consider whether it is suitable for your particular circumstances and, as necessary, seek professional advice.
Disclosure: ETFs
Any discussion or mention of an ETF is not to be construed as recommendation, promotion or solicitation. All investors should review and consider associated investment risks, charges and expenses of the investment company or fund prior to investing. Before acting on this material, you should consider whether it is suitable for your particular circumstances and, as necessary, seek professional advice.


Join The Conversation
If you have a general question, it may already be covered in our FAQs. If you have an account-specific question or concern, please reach out to Client Services.