


By Todd Stankiewicz CMT, CFP, ChFC
1/ US Dollar
2/ Is the Long Bond Oversold?
3/ Inflation Pressures Persist
4/ Tighter Credit Standards
Investopedia is partnering with CMT Association on this newsletter. The contents of this newsletter are for informational and educational purposes only, however, and do not constitute investing advice. The guest authors, which may sell research to investors, and may trade or hold positions in securities mentioned herein do not represent the views of CMT Association or Investopedia. Please consult a financial advisor for investment recommendations and services.
1/ US Dollar

Earlier this week we spoke about the long-term trend of the US Dollar being prone to a reversal. Today we zoom in to explore the price action of the last few days and how this sets up the potential longer-term trend.
On October 3rd the Invesco US Dollar Bullish ETF (UUP), a proxy for the US Dollar Index, displayed a Doji Candle. This is where buyers and sellers were equally matched. After long trends, such as one we just experienced, Doji Candles can indicate a reversal in the trend. The potential for a reversal is further increased because there is a bearish divergence present with the daily RSI. This is where the price makes a new High, but the RSI makes a lower high.
The next few candles after a Doji will be very important for confirming the reversal. To gain some further clarity, I included a Raindrop Chart. These charts help us visualize volume along with price. The October 4th candle is trading near the bottom of the price range, but the raindrop confirms that the late day volume put the most selling pressure on the ETF. This data suggests a confirmation of the Doji top and warns of further potential for downside.
2/ Is the Long Bond Oversold?

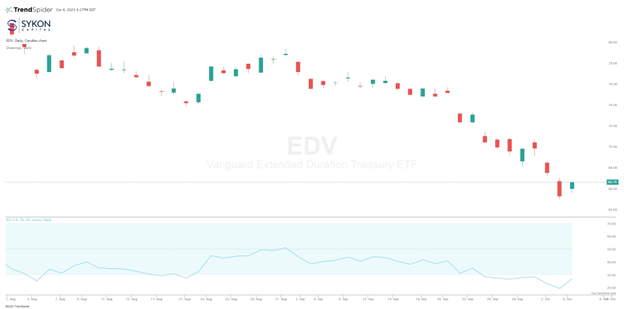
The Vanguard Extended Duration Treasury ETF (EDV) represents one of the longest duration treasury ETFs that I know of. The RSI dropped to 19.33 on October 3. This is potentially overextended to the downside. The RSI has only been this low 3 other times over the last 10 years. On October 24th, 2022, February 25th, 2021 and November 11th, 2016.
It appears that the bulls are trying to take back control vs the bears. Further examination of the raindrop chart indicates that this may very well be the case. The Raindrop Chart reveals that the volume is concentrated in the upper portion of the raindrop, suggesting a rather significant change in control vs the previous 2 days. Follow through from here may put the previous support levels in play as potential resistance zones.
3/ Inflation Persists

The market has been very hopeful that the FOMC will be cutting rates because inflation data, as indicated by CPI and PCE, has declined substantially from peak levels. The reality is that investors may be getting prematurely hopeful. US Retail Gasoline prices are rising once again after the decline. There has been a strong historical positive correlation between gasoline price and both CPI and PCE data.
Anyone who goes shopping or buys food can attest to the reality that food prices are continuing to climb. This not only contributes towards inflationary pressures but takes discretionary income out of investors’ pockets.
4/ Tightening Credit Conditions

US Credit Card debt has hit all-time highs. Much of this was fueled by low interest rates and easier credit standards. When consumers can more easily utilize credit, they can in theory spend more. Recently there has been a dramatic shift in the market conditions.
Credit Cards interest rates have spiked substantially. At the same time, banks are tightening their standards for credit card loans. This indicates that there may be significant drops in consumer spending, particularly discretionary spending because of deteriorating credit conditions. This can lead to slower growth, while inflationary pressure persists from elevated food and gasoline prices. This creates a unique condition called Stagflation. This is a condition that often makes the FOMC’s job much more difficult and puts pressure on economy and markets.
—
Originally posted 5th October 2023
Disclosure: Investopedia
Investopedia.com: The comments, opinions and analyses expressed herein are for informational purposes only and should not be considered individual investment advice or recommendations to invest in any security or to adopt any investment strategy. While we believe the information provided herein is reliable, we do not warrant its accuracy or completeness. The views and strategies described on our content may not be suitable for all investors. Because market and economic conditions are subject to rapid change, all comments, opinions and analyses contained within our content are rendered as of the date of the posting and may change without notice. The material is not intended as a complete analysis of every material fact regarding any country, region, market, industry, investment or strategy. This information is intended for US residents only.
Disclosure: Interactive Brokers
Information posted on IBKR Campus that is provided by third-parties does NOT constitute a recommendation that you should contract for the services of that third party. Third-party participants who contribute to IBKR Campus are independent of Interactive Brokers and Interactive Brokers does not make any representations or warranties concerning the services offered, their past or future performance, or the accuracy of the information provided by the third party. Past performance is no guarantee of future results.
This material is from Investopedia and is being posted with its permission. The views expressed in this material are solely those of the author and/or Investopedia and Interactive Brokers is not endorsing or recommending any investment or trading discussed in the material. This material is not and should not be construed as an offer to buy or sell any security. It should not be construed as research or investment advice or a recommendation to buy, sell or hold any security or commodity. This material does not and is not intended to take into account the particular financial conditions, investment objectives or requirements of individual customers. Before acting on this material, you should consider whether it is suitable for your particular circumstances and, as necessary, seek professional advice.
Disclosure: ETFs
Any discussion or mention of an ETF is not to be construed as recommendation, promotion or solicitation. All investors should review and consider associated investment risks, charges and expenses of the investment company or fund prior to investing. Before acting on this material, you should consider whether it is suitable for your particular circumstances and, as necessary, seek professional advice.
Disclosure: Forex
There is a substantial risk of loss in foreign exchange trading. The settlement date of foreign exchange trades can vary due to time zone differences and bank holidays. When trading across foreign exchange markets, this may necessitate borrowing funds to settle foreign exchange trades. The interest rate on borrowed funds must be considered when computing the cost of trades across multiple markets.


Join The Conversation
If you have a general question, it may already be covered in our FAQs. If you have an account-specific question or concern, please reach out to Client Services.