


1/ Detecting Two-Way Volatility
2/ Gold’s Big Number
3/ The SMH Semiconductor ETF
Investopedia is partnering with CMT Association on this newsletter. The contents of this newsletter are for informational and educational purposes only, however, and do not constitute investing advice. The guest authors, which may sell research to investors, and may trade or hold positions in securities mentioned herein do not represent the views of CMT Association or Investopedia. Please consult a financial advisor for investment recommendations and services.
1/ Detecting Two-Way Volatility
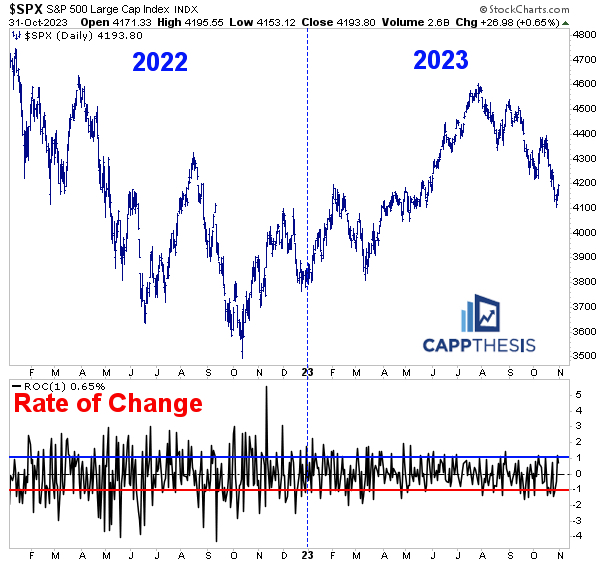
When we hear the word, volatility, we instantly think of the VIX Volatility Index. Why not? It literally measures volume based on S&P 500 index options.
When the SPX experiences a big decline, the VIX typically rises. The larger the stock market loss, the bigger the VIX advance.
This is very well understood.
It’s also not a surprise to know that in 2022, the number of daily declines of at least 1% was among the most ever at 65. It was a bear market after all. And the VIX advanced.
But there’s one thing that VIX fails to capture, and that’s volatility on UP days. There were nearly just as many 1% advances in 2022 at 63. Big advances tend to force the VIX lower. It’s just how its measured, but this gives us a false sense of security.
Emotion drives big moves in BOTH directions, thus, when the market is logging large declines and large advances, there RISK exists on both sides – up and down.
While we can’t discount the VIX, itself, we should also keep a tab on the number of sizable daily moves. A higher amount makes for a treacherous trading landscape.
2/ Gold’s Big Number
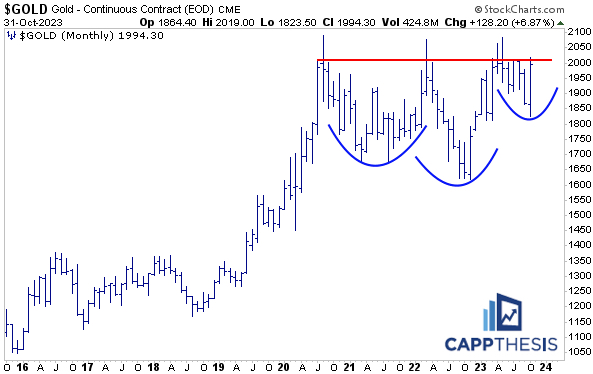
The 2,000 level for Gold is important for a few reasons. First, it has round number significance. “2,000” is easy to identify and to remember, which instantly puts it on a lot more radar screens.
Beyond that, as this long-term monthly chart shows, Gold has not closed above the 2,000 level on a monthly basis yet. It tried to in 2020, 2022 and early 2023, but those pushes through 2,000 were sold aggressively.
That said, Gold appears to be in a more promising position this time for two major reasons.
1-The 2023 pullback has been shallower than the drawdowns that resulted from 2020-21 and 2022. This shows that buyers have been more eager to buy the dip at higher prices now vs. before.
2-The recent rebound has helped construct this large potential bullish chart formation. Using the simple measured move technique, a breakout that finally holds above 2,000 would target 2,180 initially and then 2,380.
3/ The SMH Semiconductor ETF
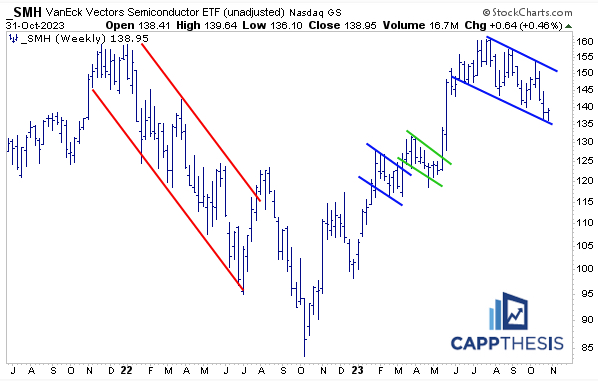
The SMH Semiconductor ETF hasn’t done much to get excited about in recent months, but could it be ready to rally again soon? Over the last four days, SMH has been oscillating around its 200-day moving average (not pictured), which it hasn’t traded considerably below since reclaiming the long-term line in January’23.
However, the weekly chart of SMH is much more interesting. The ETF now is trying to bounce from the lower trendline of the pictured trading channel. In fact, the best buying opportunities in SMH have occurred near this line three times prior since the summer months.
Bigger picture, the ETF also has a chance to turn the recent downturn into a (bullish) falling wedge pattern, like we saw twice before in 2023.
—
Originally posted 1st November 2023
Disclosure: Investopedia
Investopedia.com: The comments, opinions and analyses expressed herein are for informational purposes only and should not be considered individual investment advice or recommendations to invest in any security or to adopt any investment strategy. While we believe the information provided herein is reliable, we do not warrant its accuracy or completeness. The views and strategies described on our content may not be suitable for all investors. Because market and economic conditions are subject to rapid change, all comments, opinions and analyses contained within our content are rendered as of the date of the posting and may change without notice. The material is not intended as a complete analysis of every material fact regarding any country, region, market, industry, investment or strategy. This information is intended for US residents only.
Disclosure: Interactive Brokers
Information posted on IBKR Campus that is provided by third-parties does NOT constitute a recommendation that you should contract for the services of that third party. Third-party participants who contribute to IBKR Campus are independent of Interactive Brokers and Interactive Brokers does not make any representations or warranties concerning the services offered, their past or future performance, or the accuracy of the information provided by the third party. Past performance is no guarantee of future results.
This material is from Investopedia and is being posted with its permission. The views expressed in this material are solely those of the author and/or Investopedia and Interactive Brokers is not endorsing or recommending any investment or trading discussed in the material. This material is not and should not be construed as an offer to buy or sell any security. It should not be construed as research or investment advice or a recommendation to buy, sell or hold any security or commodity. This material does not and is not intended to take into account the particular financial conditions, investment objectives or requirements of individual customers. Before acting on this material, you should consider whether it is suitable for your particular circumstances and, as necessary, seek professional advice.
Disclosure: Futures Trading
Futures are not suitable for all investors. The amount you may lose may be greater than your initial investment. Before trading futures, please read the CFTC Risk Disclosure. A copy and additional information are available at ibkr.com.
Disclosure: ETFs
Any discussion or mention of an ETF is not to be construed as recommendation, promotion or solicitation. All investors should review and consider associated investment risks, charges and expenses of the investment company or fund prior to investing. Before acting on this material, you should consider whether it is suitable for your particular circumstances and, as necessary, seek professional advice.


Join The Conversation
If you have a general question, it may already be covered in our FAQs. If you have an account-specific question or concern, please reach out to Client Services.