


By Ryan Gorman, CFA, CMT, BFA
1/ A Daily Look at Oil
2/ A Weekly Look at S&P 500
3/ An Hourly Look at Nasdaq 100
Investopedia is partnering with CMT Association on this newsletter. The contents of this newsletter are for informational and educational purposes only, however, and do not constitute investing advice. The guest authors, which may sell research to investors, and may trade or hold positions in securities mentioned herein do not represent the views of CMT Association or Investopedia. Please consult a financial advisor for investment recommendations and services.
1/ A Daily Look at Oil
Today is my final piece and I wanted to do something a bit different. There are a lot of different strategies and time frames. I mentioned finding what works for you and sticking with it! We have spoken about trend and momentum, support and resistance this week. These things keep you in gear with the markets.
I have found some pattern recognition really interesting. During my Chartered Market Technician studies, I learned about Elliot Wave. The idea of structure to the market was fascinating to me. I was never able to learn it well enough to use it effectively. However, I came across the book Trade What You See by Larry Pesavento. In this book he talks a lot about different patterns, one of which is ABCD. The AB move is comparable in size to the CD move and the correction move BC is often some Fibonacci ratios. 38.2%, 50% or 61.8%. Nothing works all the time, but what I like about this is that there are clear spots to know when something else is happening.
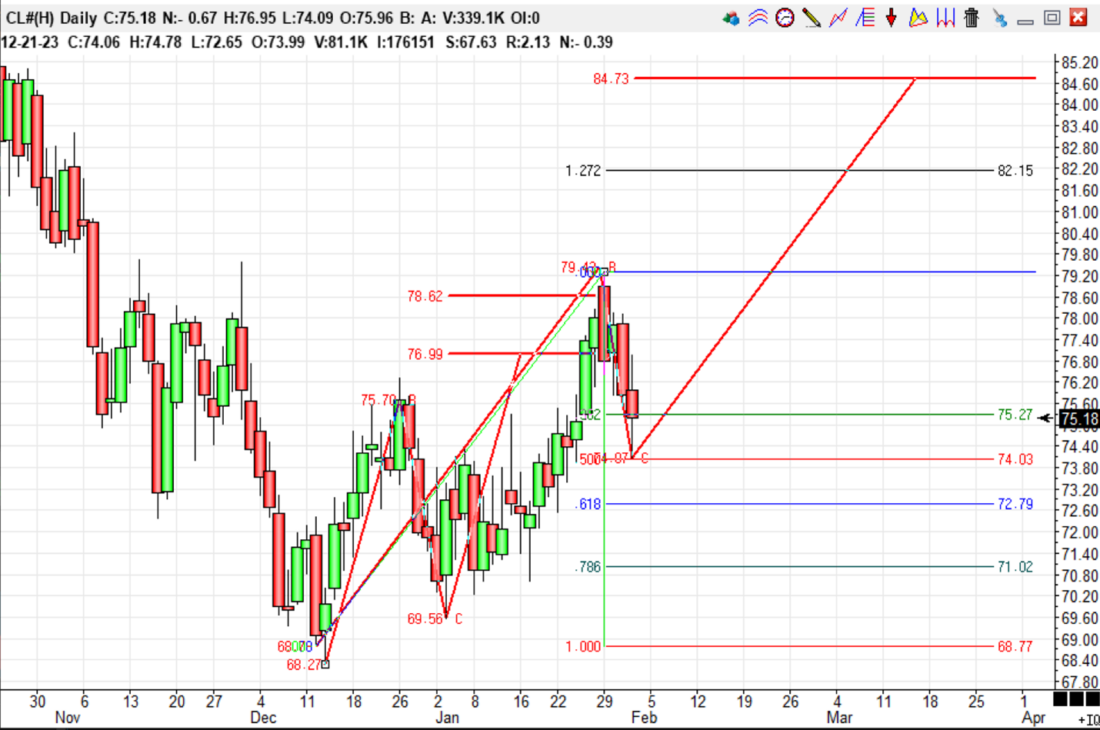
Here we see a daily chart of oil. There was a bullish ABCD move from the December low around 68.27. 78.62 was an extension target. The actual high was 79.43, so far from perfect but a reversal did come that retraced half the move. The small ABCD was an AB move of a larger formation. The AB=CD target would be 84.73. You could use a move below the recent pivot as a stop or you could use the 61.8% level around 72.79. If you used the 61.8% level you would risk around $2.40. If the target is hit at 84.73 you make $9.55. This is almost a 4-1 risk to reward ratio.
2/ A Weekly Look at S&P 500
The nice thing about technical analysis, including pattern recognition is that it does not matter the instrument or the time frame. The patterns are the same.
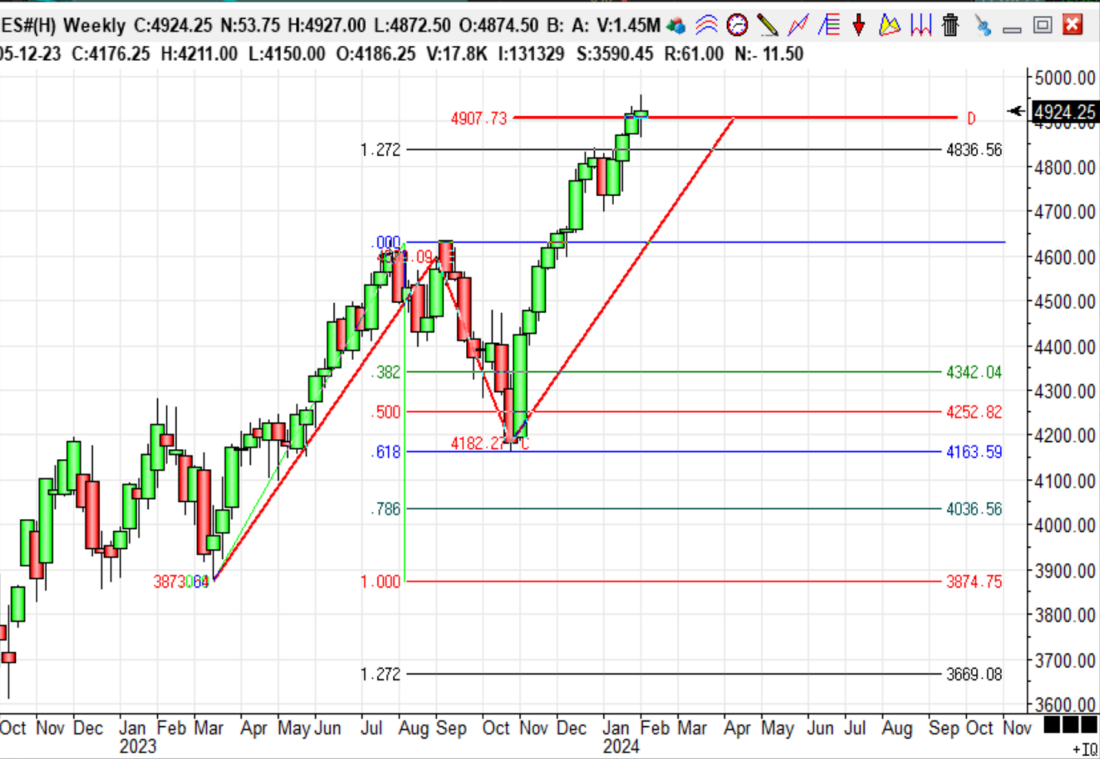
Here is a weekly chart of the S&P 500 futures. There has been a big of an overshoot, but there could be a turn. How a correction behaves would help us know if there is still a bullish trend or a trend change. A first target would be a 38.2% retracement of the move off the October low, this is around 4650. This would be a normal and healthy correction. How it unfolds would tell us more about what may be happening, but one step at a time!
3/ An Hourly Look at Nasdaq 100
On shorter timeframes you have more patterns to view. I wanted to show this one as it develops in real time. We have 2 ways it could play out.
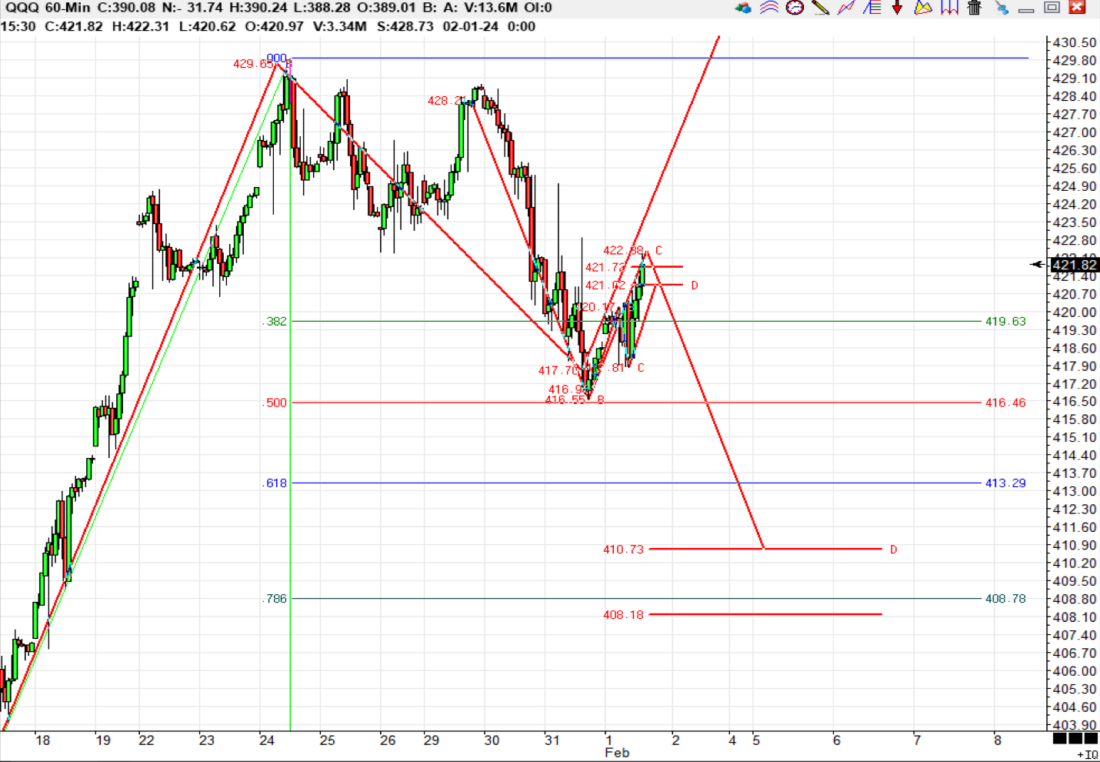
The low on the 17th of January to the high on the 24th corrected 50% of the move to the Wednesday low. This could be a correction that targets the upside of around 444.13!
Alternatively, there was an ABCD up from the low on Wednesday the 31st that could be completing as the upward correction that would target a move down to 410.73.
I hope you have found this as interesting as I have. While targets and patterns can be done many ways, I have liked these tools as well as how it can be turned into a formal trading plan.
—
Originally posted 2nd February 2024
Disclosure: Investopedia
Investopedia.com: The comments, opinions and analyses expressed herein are for informational purposes only and should not be considered individual investment advice or recommendations to invest in any security or to adopt any investment strategy. While we believe the information provided herein is reliable, we do not warrant its accuracy or completeness. The views and strategies described on our content may not be suitable for all investors. Because market and economic conditions are subject to rapid change, all comments, opinions and analyses contained within our content are rendered as of the date of the posting and may change without notice. The material is not intended as a complete analysis of every material fact regarding any country, region, market, industry, investment or strategy. This information is intended for US residents only.
Disclosure: Interactive Brokers
Information posted on IBKR Campus that is provided by third-parties does NOT constitute a recommendation that you should contract for the services of that third party. Third-party participants who contribute to IBKR Campus are independent of Interactive Brokers and Interactive Brokers does not make any representations or warranties concerning the services offered, their past or future performance, or the accuracy of the information provided by the third party. Past performance is no guarantee of future results.
This material is from Investopedia and is being posted with its permission. The views expressed in this material are solely those of the author and/or Investopedia and Interactive Brokers is not endorsing or recommending any investment or trading discussed in the material. This material is not and should not be construed as an offer to buy or sell any security. It should not be construed as research or investment advice or a recommendation to buy, sell or hold any security or commodity. This material does not and is not intended to take into account the particular financial conditions, investment objectives or requirements of individual customers. Before acting on this material, you should consider whether it is suitable for your particular circumstances and, as necessary, seek professional advice.
Disclosure: Futures Trading
Futures are not suitable for all investors. The amount you may lose may be greater than your initial investment. Before trading futures, please read the CFTC Risk Disclosure. A copy and additional information are available at ibkr.com.
Disclosure: ETFs
Any discussion or mention of an ETF is not to be construed as recommendation, promotion or solicitation. All investors should review and consider associated investment risks, charges and expenses of the investment company or fund prior to investing. Before acting on this material, you should consider whether it is suitable for your particular circumstances and, as necessary, seek professional advice.


Join The Conversation
If you have a general question, it may already be covered in our FAQs. If you have an account-specific question or concern, please reach out to Client Services.