


1/ Break Downs vs. Break Outs
2/ A Breadth Crossroads
3/ High-Yield Debt Insights
4/ Key Turning Points
Investopedia is partnering with CMT Association on this newsletter. The contents of this newsletter are for informational and educational purposes only, however, and do not constitute investing advice. The guest authors, which may sell research to investors, and may trade or hold positions in securities mentioned herein do not represent the views of CMT Association or Investopedia. Please consult a financial advisor for investment recommendations and services.
1/ Break Downs vs. Break Outs
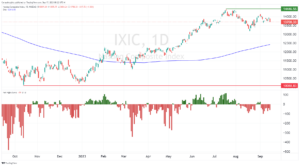
The outsized concentration of a few mega-cap tech stocks in indexes like the Nasdaq 100 has reduced the effectiveness of some market cap-weight indexes to represent the action of most stocks. Looking at the daily difference between 52-week highs and 52-week lows (red and green columns below)
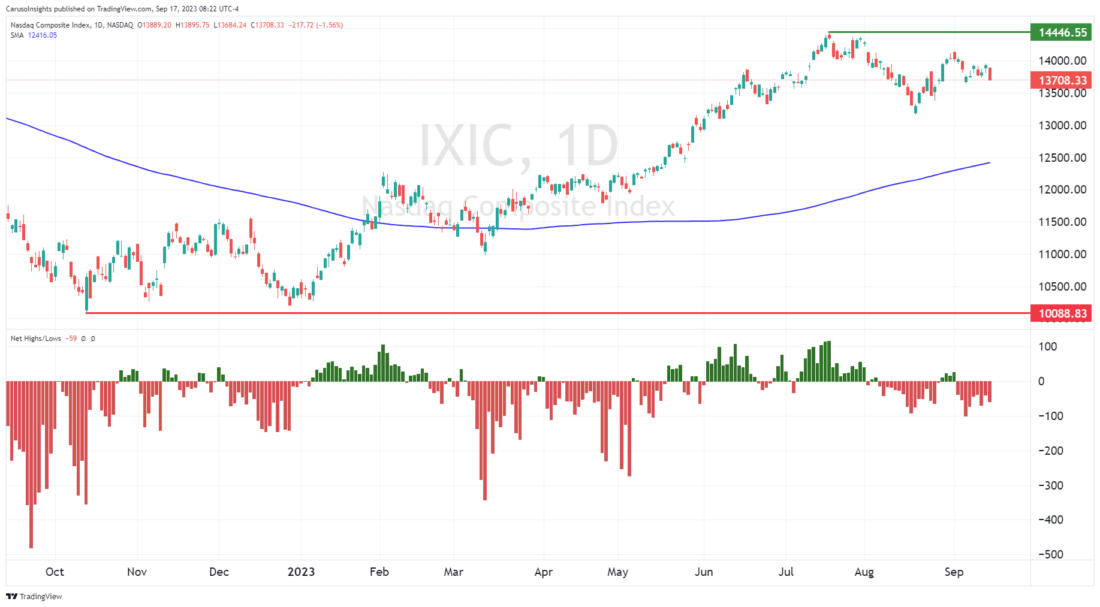
helps to gauge whether more stocks are strengthening or weakening. This metric is important as it shows participation and a willingness for investors to pay the highest or lowest price seen in a year.
Despite the Nasdaq Composite having advanced 35% from its 52-week low and having only retraced 5% from its 52-week high, we currently have more stocks making new lows than highs. This is an abnormal internal dynamic and one that helps us visualize the broader weakness than many market-cap-weighted indexes would lead us to believe.
Healthy bull markets with broad participation typically have more new 52-week highs than new 52-week lows daily. In addition, healthy bull markets have a minimum of 50+ new 52-week highs each day on both the Nasdaq and NYSE composites. Friday saw only 28 new 52-week highs on the Nasdaq and 34 on the NYSE.
I use this metric as both a trend tool and a way to gauge speculative interest. Unlike other breadth measures, such as advancers vs. decliners, 52-week highs and lows can be viewed as stocks breaking out vs. breaking down. More speculative stocks, such as high-growth stocks, tend to have stronger trend moves in an environment of new highs outpacing new lows.
2/ A Breadth Crossroads
To follow up on our internal participation and breadth measures analysis, the percentage of stocks trading above their respective 50-day moving averages helps convey how many stocks are trending higher or lower.
As with virtually all technical tools, context is key for the proper use of this measure. Similar to momentum oscillators, the levels that are associated with extremes and reversals will shift depending on whether we are trending higher or lower.
As can be seen in Chart 2, bull market upside extremes are associated with the percentage of stocks above their 50-day average reaching above 85% and market lows with readings of approximately 30%. This range will shift in bear markets, seeing market lows occurring only with extremely low readings of roughly 15%. In addition, market highs are seen with readings of approximately 75%, well below bull market extremes.

The percentage of Nasdaq stocks above their respective 50-day average is currently at 29%. How markets react from here will help us identify if we have entered a new downtrend or remain in an uptrending market. If we remain in an uptrend, we should have imminent upside participation among most stocks.
3/ High-Yield Debt Insights
We often think of the stock market as simply a basket of stocks. However, there are many clearly defined groups within it. Well-capitalized and mature companies with investment-grade debt represent very different investment opportunities from recent high-growth IPOs with negative cashflows. Many stocks that grab headlines with sizeable moves operate as more speculative investment vehicles.
My preferred gauge for understanding when this speculative group will have a monetary tailwind is the ICE BofA US High Yield Index (orange line in chart 3). This index is particularly helpful because it relays two vital pieces of information – credit, and risk.

High-yield debt carries much more risk than investment-grade or government debt. The index is affected both by interest rates and corporate risk trends. Therefore, a falling High Yield Index provides multiple bullish implications for speculative stocks – lower financing costs, higher multiples, and lower risk.
A reasonable explanation for the narrow leadership in this year’s market-cap weighted indexes is that the High-Yield part of the debt spectrum has remained stubbornly high. A break lower in this index will help to convey two critical points: 1) Interest rates have peaked while 2) corporate risk remains subdued.
A decisive break lower will likely coincide with the next major bull market, where speculative stocks once again lead in performance.
4/ Key Turning Points
The Russell 2000 has been one of the weakest-performing broad indexes in 2023. Without a concentration in investment grade equities flexing their pricing power, such as the Nasdaq 100, the Russell 2000 small cap index, as seen in chart 4, has been entirely range-bound for nearly 18 months.

It remains firmly within clearly defined resistance and support levels. Volatility has begun diminishing, as seen by the narrowing trendline surrounding price extremes. Putting aside all economic uncertainties, a decisive break higher or lower out of this crucial range will likely establish the next major trend for most equities.
—
Originally posted 18th September 2023
Disclosure: Investopedia
Investopedia.com: The comments, opinions and analyses expressed herein are for informational purposes only and should not be considered individual investment advice or recommendations to invest in any security or to adopt any investment strategy. While we believe the information provided herein is reliable, we do not warrant its accuracy or completeness. The views and strategies described on our content may not be suitable for all investors. Because market and economic conditions are subject to rapid change, all comments, opinions and analyses contained within our content are rendered as of the date of the posting and may change without notice. The material is not intended as a complete analysis of every material fact regarding any country, region, market, industry, investment or strategy. This information is intended for US residents only.
Disclosure: Interactive Brokers
Information posted on IBKR Campus that is provided by third-parties does NOT constitute a recommendation that you should contract for the services of that third party. Third-party participants who contribute to IBKR Campus are independent of Interactive Brokers and Interactive Brokers does not make any representations or warranties concerning the services offered, their past or future performance, or the accuracy of the information provided by the third party. Past performance is no guarantee of future results.
This material is from Investopedia and is being posted with its permission. The views expressed in this material are solely those of the author and/or Investopedia and Interactive Brokers is not endorsing or recommending any investment or trading discussed in the material. This material is not and should not be construed as an offer to buy or sell any security. It should not be construed as research or investment advice or a recommendation to buy, sell or hold any security or commodity. This material does not and is not intended to take into account the particular financial conditions, investment objectives or requirements of individual customers. Before acting on this material, you should consider whether it is suitable for your particular circumstances and, as necessary, seek professional advice.
Disclosure: ETFs
Any discussion or mention of an ETF is not to be construed as recommendation, promotion or solicitation. All investors should review and consider associated investment risks, charges and expenses of the investment company or fund prior to investing. Before acting on this material, you should consider whether it is suitable for your particular circumstances and, as necessary, seek professional advice.


Join The Conversation
If you have a general question, it may already be covered in our FAQs. If you have an account-specific question or concern, please reach out to Client Services.