


By Alex Cole
1/ First Layer: Higher Highs
2/ Second Layer: Moving Averages
3/ Third Layer: Confirmation
4/ Putting it Together
5/ $AAPL Starts New “Go” Trend
Investopedia is partnering with CMT Association on this newsletter. The contents of this newsletter are for informational and educational purposes only, however, and do not constitute investing advice. The guest authors, which may sell research to investors, and may trade or hold positions in securities mentioned herein do not represent the views of CMT Association or Investopedia. Please consult a financial advisor for investment recommendations and services.
1/ First Layer: Higher Highs
Trend identification is arguably the most important skill we can learn as investors and technical analysts. If we can identify a trend in price action early enough, then we can profit on the majority of the move. This is of course simple in concept but not easy in practice. Luckily we have a full suite of tools in our charting toolbox that we can use. In this first chart, we will take a step toward building a disciplined process of trend identification using the prices of Apple, Inc (AAPL)
As we know, an up trend can be defined as price action that makes a series of higher highs and higher lows. We can use our eyes to determine whether or not this is the case, but to remove subjectivity, we can turn to an indicator like Donchian Channels. This will help automate the process. Donchian channels plot an upper line that marks the highest price of a lookback period (typically, 20) and a lower line that marks the lowest low of the lookback period. As we see in the chart, price has rallied far enough from its most recent low to cause the upper Donchian line to move higher, indicating a new high (gray arrow).

2/ Second Layer: Moving Averages
In an effort to build our weight of the evidence approach, we might turn to moving averages. The use of moving averages is incredibly prevalent throughout the investing community and for good reason. Knowing where price is relative to a moving average is very helpful. For example, if price is trading above a moving average that is inherently bullish, as we know that market participants have pushed price higher than its historical average. In our second chart, the green arrow indicates the area where prices climbed above the 60-period moving average.

Of course, if one moving average is good, many investors think two are better! Indeed, the interplay between two moving averages is a concept that is well used and can signal to a chartist a changing trend. The light blue arrow on the chart shows us where the short-term moving average (10-period) crosses above the longer period moving average. This can be read as a bullish situation because recent prices are rising fast relative to the average that incorporates a larger set of data.
3/ Third Layer: Confirmation
We want to stack the odds in our favor when attempting to identify a new trend. Adding more of the foundational concepts of technical analysis to our chart can enhance confidence in our decisions. One of the most valuable indicators we have at our disposal is the Bollinger Bands indicator. These bands are plotted using 2 standard deviations around a mean. Statistically, we know that 2 standard deviations should encompass about 95% of a set of normally distributed data. Granted, financial data sets are not normally distributed but if price is trading outside of these bands that is significant! This often happens at the start of a new trend in price action. On this 3rd chart, the green arrow highlights this unusual activity.

Another well-known indicator is the MACD: Moving Average Convergence Divergence indicator. An indicator that combines aspects of trend and momentum, the MACD is the difference between two exponential moving averages. The white ellipse in the lower panel of this chart highlights an area showing that MACD has crossed above its Signal line, and both lines are moving into positive territory. Both of these situations can be read as bullish.
4/ Putting it Together
We are well on our way now to creating a disciplined checklist that will help us identify trends. Chart 4 shows us what this process looks like if we put all of the components on the chart at the same time. Somewhere on the right side of this chart, we should feel fairly certain we have identified a new uptrend. We have a new Donchian Channel high, price is above its moving average. A little later we have a moving average crossover, the upper bound of the Bollinger Band has been broken and signs from the MACD are positive.

However, it is at this point that we are risking making our chart hard to read. The more indicators and lines we add to the chart the more overwhelming it can be and the more we reintroduce subjectivity. In an attempt to build confidence we can create doubt.
5/ $AAPL Starts New “Go” Trend
In the last chart, we see the prices of Apple, Inc (AAPL) with the GoNoGo Trend indicator applied.
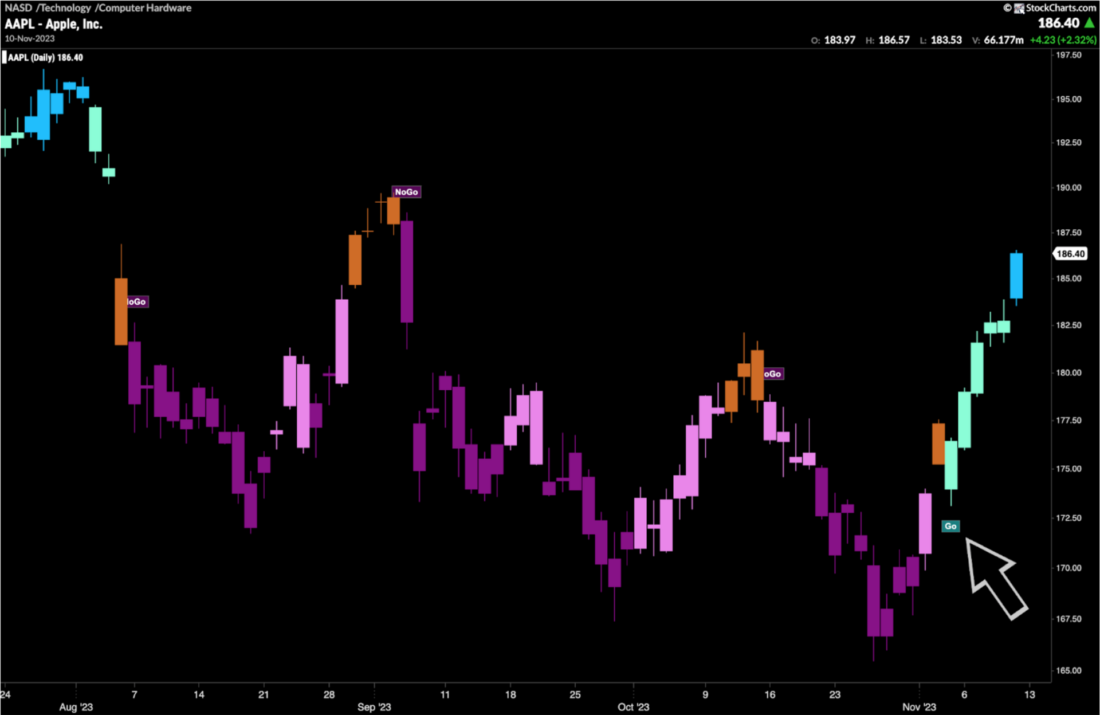
This indicator blends in the background some of the foundational and commonly used technical analysis concepts and indicators, and color codes the price bar according to the strength of its trend. In this way, price remains the focus. “Go” colors are blue and aqua, with blue being the strongest form. “NoGo” colors are pink and purple, with purple being the strongest form. Amber bars are “Go Fish” bars that represent uncertainty. We see that there is a new “Go” trend in place for Apple, Inc using the GoNoGo Trend indicator. With clarity, we are able to participate in trends by remaining objective and sticking to the rules. Knowing the state of the trend can help us remove doubt and uncertainty and act responsibly. It’s a “Go”!
—
Originally posted 13th November 2023
Disclosure: Investopedia
Investopedia.com: The comments, opinions and analyses expressed herein are for informational purposes only and should not be considered individual investment advice or recommendations to invest in any security or to adopt any investment strategy. While we believe the information provided herein is reliable, we do not warrant its accuracy or completeness. The views and strategies described on our content may not be suitable for all investors. Because market and economic conditions are subject to rapid change, all comments, opinions and analyses contained within our content are rendered as of the date of the posting and may change without notice. The material is not intended as a complete analysis of every material fact regarding any country, region, market, industry, investment or strategy. This information is intended for US residents only.
Disclosure: Interactive Brokers
Information posted on IBKR Campus that is provided by third-parties does NOT constitute a recommendation that you should contract for the services of that third party. Third-party participants who contribute to IBKR Campus are independent of Interactive Brokers and Interactive Brokers does not make any representations or warranties concerning the services offered, their past or future performance, or the accuracy of the information provided by the third party. Past performance is no guarantee of future results.
This material is from Investopedia and is being posted with its permission. The views expressed in this material are solely those of the author and/or Investopedia and Interactive Brokers is not endorsing or recommending any investment or trading discussed in the material. This material is not and should not be construed as an offer to buy or sell any security. It should not be construed as research or investment advice or a recommendation to buy, sell or hold any security or commodity. This material does not and is not intended to take into account the particular financial conditions, investment objectives or requirements of individual customers. Before acting on this material, you should consider whether it is suitable for your particular circumstances and, as necessary, seek professional advice.


Join The Conversation
If you have a general question, it may already be covered in our FAQs. If you have an account-specific question or concern, please reach out to Client Services.