


Investopedia is partnering with CMT Association on this newsletter. The contents of this newsletter are for informational and educational purposes only, however, and do not constitute investing advice. The guest authors, which may sell research to investors, and may trade or hold positions in securities mentioned herein do not represent the views of CMT Association or Investopedia. Please consult a financial advisor for investment recommendations and services.
1/ Single Stick Reversal
In my analysis, the type of chart I tend to gravitate toward are known as candlestick charts. To the untrained eye they appear as random mix of red and green confusion. When you get to know how to use them, they can change the way you look at price movement. This technique is nothing new as it is thought to have been developed by a Japanese rice trader in the 18th century.
Rather than using a simple line chart with a single data point, candlesticks tell us what the low, high, open, and close of a given period. This helps us visualize the stocks trading range in relation to the open or close.
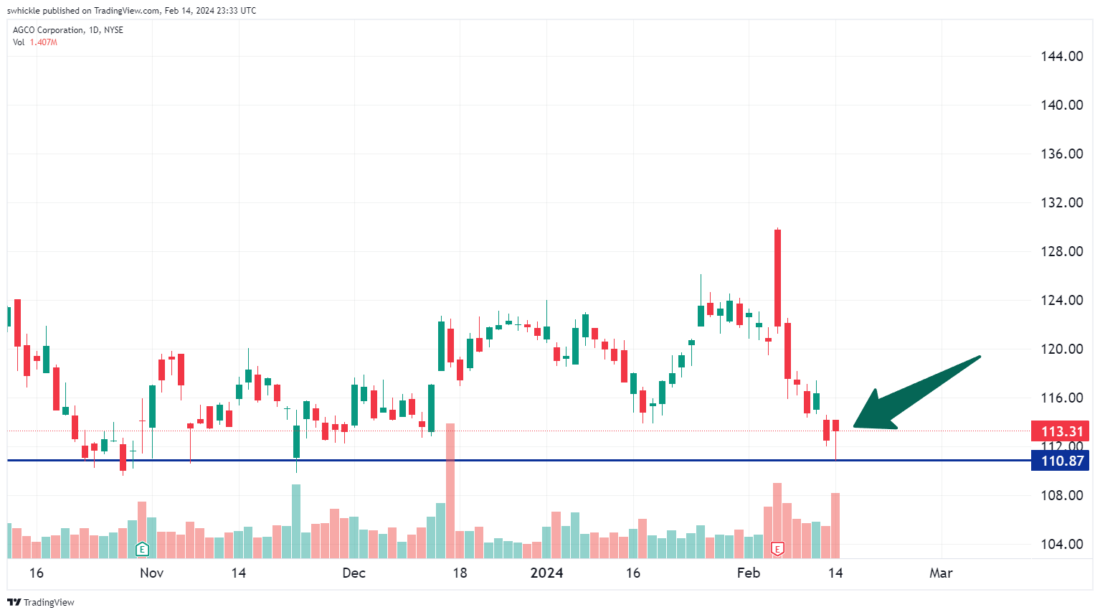
Not every candlestick helps us shine light on what could happen but there are some that can give us clues as in the case of AGCO Corporation (AGCO). AGCO reported earnings on Feb 6th and since then has traded off its highs and right back down to a multi-month support level. The type of daily candlestick from yesterday is known as a “Hammer” which is characterized by having a narrow real body with an elongated lower wick. To qualify as a Hammer the lower wick needs to be at least 2 times the length of the real body.
What makes the pattern form is the interesting part. During the trading period the sellers begin pouncing on the stock causing it to make a new low. After being beaten down, buyers step in driving the stock back up near the opening price of the day. Effectively the bears were in charge but by the end of the period the bulls have regained control.
Confirmation of a reversal would come in the form of a follow through day with a close above the hammer on higher than average volume.
2/ Two Stick Trading
Single candlestick patterns can be less reliable than a two-candle pattern Lets now look at a two-candlestick bullish reversal pattern called a Bullish Harami.
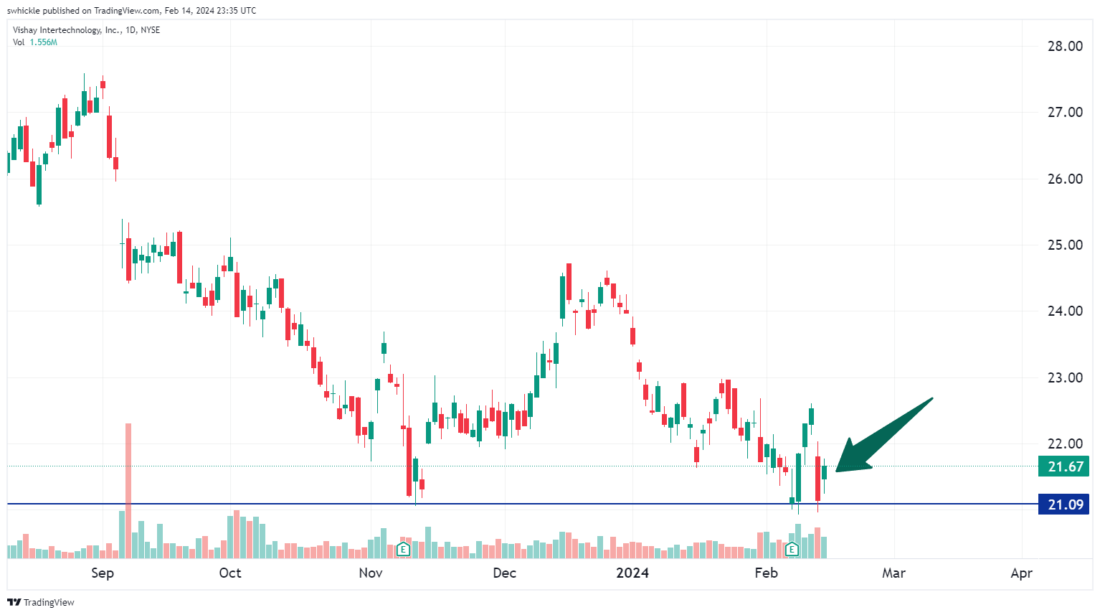
In the case of Vishay Intertechnology (VSH) a potential bullish reversal pattern could be forming reversing a near 25% off its all-time high set back in July. VSH reported earnings on Feb 7th and initially counter to the trend, followed by three consecutive days of positive price action. Tuesday’s decline in the broad market was enough to erase the previous day’s gains. The bulls however showed up yesterday keeping VSH from retesting multi month support.
VSH now has a narrow-bodied bullish candle that is completely engulfed by the real body of the previous day. Harami comes from an old Japanese word for pregnant as the two-candle pattern resembles someone who is pregnant. The narrower the body on the second candle gives the pattern a better chance of playing out in our favor. In this case we are also effectively sitting on support which can give us more confidence in the direction of a breakout.
Trading single or double candlestick patterns can be a challenge as not all patterns have the same success rate. It is important to use other tools that you believe in to help make a case for making trading decisions. Candlestick patterns when combined with momentum indicators such as Relative Strength Index (RSI) or other oscillators can give the trader more confidence that a breakout will occur in the expected direction. There is no secret sauce to identifying and trading these types of patterns. Practice, risk management, and position sizing are very important things to consider when trading chart formations. Now let’s see how this plays out over the next few trading sessions.
3/ Semi-Concerned
Recognizing chart patterns as they are forming is one effective way to help understand where markets have the potential to move. Human behaviors repeat in recognizable patterns displayed on charts, expressed through buy and sell orders. Algorithms, believe it or not, were programed by humans and still exhibit the behaviors of the person who created it. These patterns are fractal and show up in all time frames across all asset classes.
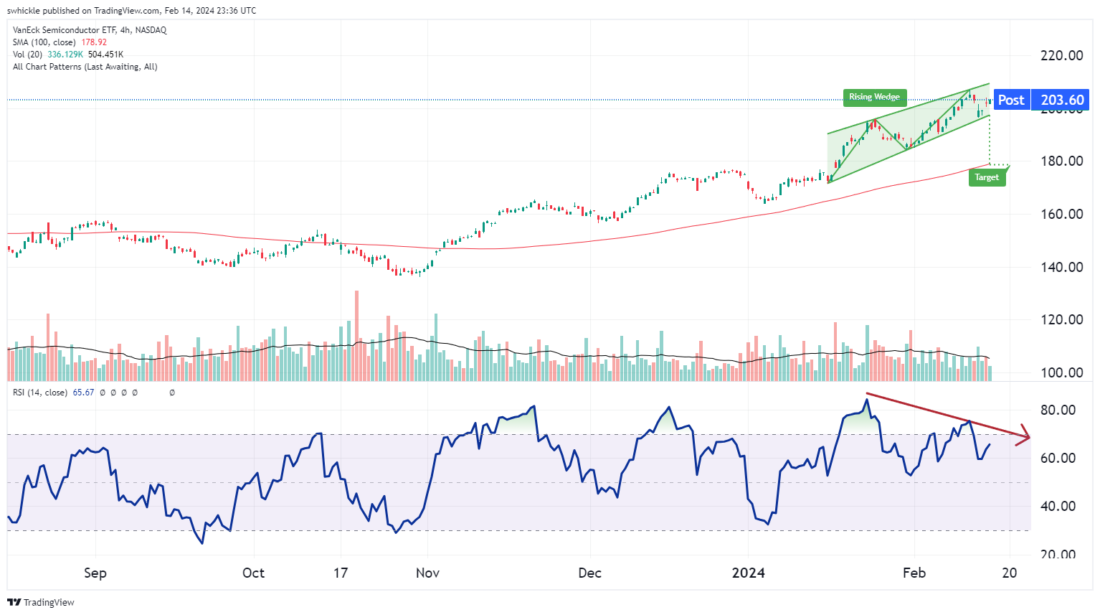
I don’t often use patterns to trade, but I use them to understand what is happening. Look at the VanEck Semiconductor ETF (SMH ) chart, as a proxy for the semiconductor industry. The primary trend is positive, in a big way as of late, but prices cannot go up forever as we know. Eventually the euphoria will run out and fewer and fewer dollars will be thrown at this trend.
With SMH there is a potential rising wedge pattern forming as price ranges begin to narrow. This is a bearish reversal pattern and is characterized by upward sloping trendlines that will seem to meet at some point in the future. As the pattern rises volumes generally begins to wane. The concept behind this pattern centers around sellers becoming more and more anxious as the trend continues to advance. Buyers step in and drive the stock higher each time but eventually buyers become sellers and prices fall breaking trend often on heavy volume. Look for a pullback up to the trend and then a future decline in price as confirmation of a trend reversal.
The bearish divergence reading we are getting from the Relative Strength Index (RSI) is another indication of the potential for a reversal. While I am not convinced this one is fully developed but it is one I am watching very closely as the rest of its constituents finish up reporting earnings.
—
Originally posted February 15th 2024
Join The Conversation
If you have a general question, it may already be covered in our FAQs. If you have an account-specific question or concern, please reach out to Client Services.
Leave a Reply
Disclosure: Investopedia
Investopedia.com: The comments, opinions and analyses expressed herein are for informational purposes only and should not be considered individual investment advice or recommendations to invest in any security or to adopt any investment strategy. While we believe the information provided herein is reliable, we do not warrant its accuracy or completeness. The views and strategies described on our content may not be suitable for all investors. Because market and economic conditions are subject to rapid change, all comments, opinions and analyses contained within our content are rendered as of the date of the posting and may change without notice. The material is not intended as a complete analysis of every material fact regarding any country, region, market, industry, investment or strategy. This information is intended for US residents only.
Disclosure: Interactive Brokers
Information posted on IBKR Campus that is provided by third-parties does NOT constitute a recommendation that you should contract for the services of that third party. Third-party participants who contribute to IBKR Campus are independent of Interactive Brokers and Interactive Brokers does not make any representations or warranties concerning the services offered, their past or future performance, or the accuracy of the information provided by the third party. Past performance is no guarantee of future results.
This material is from Investopedia and is being posted with its permission. The views expressed in this material are solely those of the author and/or Investopedia and Interactive Brokers is not endorsing or recommending any investment or trading discussed in the material. This material is not and should not be construed as an offer to buy or sell any security. It should not be construed as research or investment advice or a recommendation to buy, sell or hold any security or commodity. This material does not and is not intended to take into account the particular financial conditions, investment objectives or requirements of individual customers. Before acting on this material, you should consider whether it is suitable for your particular circumstances and, as necessary, seek professional advice.
Disclosure: ETFs
Any discussion or mention of an ETF is not to be construed as recommendation, promotion or solicitation. All investors should review and consider associated investment risks, charges and expenses of the investment company or fund prior to investing. Before acting on this material, you should consider whether it is suitable for your particular circumstances and, as necessary, seek professional advice.


Does this candlestick patterns shows implicitly shows the orders that has been sweep by institutions that’s why it’s going to reverse?