


From SIA Charts
Investopedia is partnering with CMT Association on this newsletter. The contents of this newsletter are for informational and educational purposes only, however, and do not constitute investing advice. The guest authors, which may sell research to investors, and may trade or hold positions in securities mentioned herein do not represent the views of CMT Association or Investopedia. Please consult a financial advisor for investment recommendations and services.
1/ Hudbay Minerals Inc
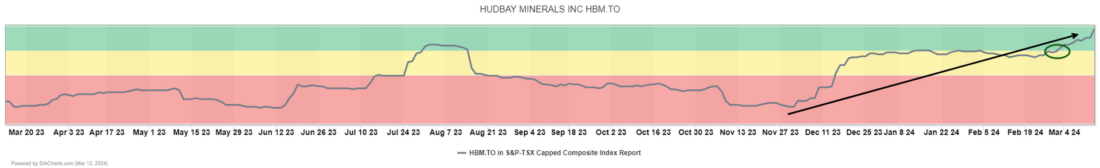
At SIACharts, we compare head-to-head battles of thousands of stocks, commodities, mutual funds and exchange traded funds daily and rank them by who is winning the most in their respective universes. The top 25% are considered the Green Favored Zone, 26-50% make up the Yellow Neutral Zone and the bottom half of each league table is considered the Red Unfavored Zone. SIA Charts relative strength reports also provides investors with an indication of changing and ongoing trends in a stock’s performance relative to its peers.
Base metal miner Hudbay Minerals (HBM.TO) has been climbing back up the rankings in the SIA S&P/TSX Composite Index Report since late November. It left the red zone in December and at the start of this month, it returned to the Green Favored Zone for the first time since August.
Hudbay finished yesterday in 9th place, up 21 spots on the day and up 63 positions in the last month. Over the last month, the shares have rallied 33.5%, compared with a gain of 6.7% for the S&P/TSX Composite over the same period. Three weeks ago, Hudbay Minerals (HBM.TO) staged a major breakout over $8.00, completing a big Ascending Triangle base that had been forming since July of 2022. Since then, the shares have continued to climb, indicating ongoing accumulation, and have rallied up above the $9.00 level for the first time since April of 2022, nearly two years.
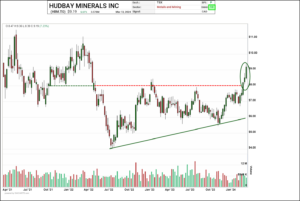
2/ Candlestick Chart
Potential upside resistance tests on trend appear near the $10.00 round number, then $10.50 based on a measured move, the spring 2021 peak near $11.25 and then $12.00 based on a larger measured move. Initial support appears at the $8.00 recent breakout point.

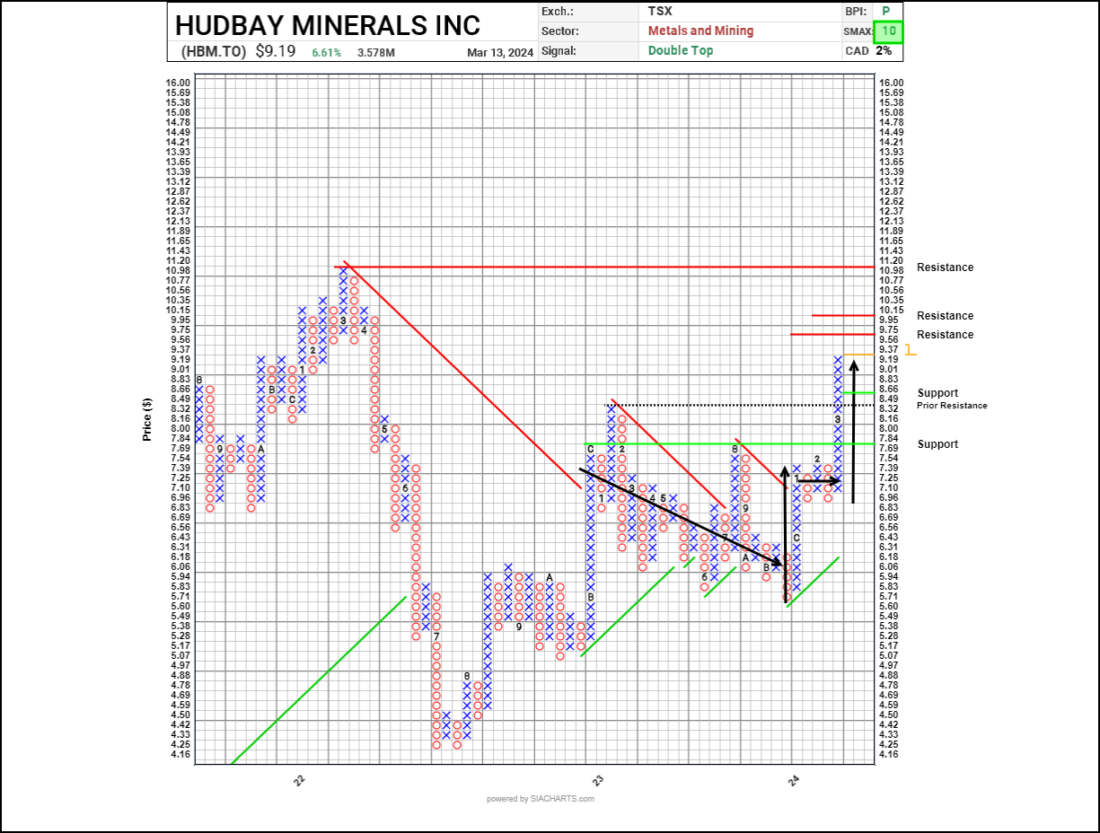
3/ Point and Figure Chart
Hudbay Minerals (HBM.TO) spent 2023 under general distribution, retreating in a falling channel of lower highs and lower lows. Since the start of this year, the shares have turned around and come under accumulation. Following an initial January rally, HBM.TO consolidated its gains at higher levels in February, then launched into a new upleg in March, a classic Step or Staircase accumulation pattern. Currently, HBM.TO is trading at its highest levels in nearly two years. Next potential resistance appears in the $9.75 to $10.15 area where vertical and horizontal counts cluster around the $10.00 round number, followed by the March 2022 peak near $11.20 on trend. Initial support appears near $8.50 based on a 3-box reversal.
With a perfect bullish SMAX score (which is a near-term 1 to 90-day indicator comparing an asset against different equal-weight asset classes) of 10 out of 10, HBM.TO is exhibiting short-term strength against the asset classes.
—
Originally posted on March 15th 2024
Disclosure: Investopedia
Investopedia.com: The comments, opinions and analyses expressed herein are for informational purposes only and should not be considered individual investment advice or recommendations to invest in any security or to adopt any investment strategy. While we believe the information provided herein is reliable, we do not warrant its accuracy or completeness. The views and strategies described on our content may not be suitable for all investors. Because market and economic conditions are subject to rapid change, all comments, opinions and analyses contained within our content are rendered as of the date of the posting and may change without notice. The material is not intended as a complete analysis of every material fact regarding any country, region, market, industry, investment or strategy. This information is intended for US residents only.
Disclosure: Interactive Brokers
Information posted on IBKR Campus that is provided by third-parties does NOT constitute a recommendation that you should contract for the services of that third party. Third-party participants who contribute to IBKR Campus are independent of Interactive Brokers and Interactive Brokers does not make any representations or warranties concerning the services offered, their past or future performance, or the accuracy of the information provided by the third party. Past performance is no guarantee of future results.
This material is from Investopedia and is being posted with its permission. The views expressed in this material are solely those of the author and/or Investopedia and Interactive Brokers is not endorsing or recommending any investment or trading discussed in the material. This material is not and should not be construed as an offer to buy or sell any security. It should not be construed as research or investment advice or a recommendation to buy, sell or hold any security or commodity. This material does not and is not intended to take into account the particular financial conditions, investment objectives or requirements of individual customers. Before acting on this material, you should consider whether it is suitable for your particular circumstances and, as necessary, seek professional advice.


Join The Conversation
If you have a general question, it may already be covered in our FAQs. If you have an account-specific question or concern, please reach out to Client Services.